
Ecommerce analytics guide
Ecommerce Analytics Consulting for Better Store Decisions
Know what a consultant should fix, which ecommerce metrics need trust first, and when a cleaner GA4 or Power BI setup is enough.
Ecommerce analytics consulting helps online stores turn sales, marketing, customer, product, and operational data into reporting they can trust. The useful work is rarely just a nicer dashboard. It is usually a mix of tracking repair, GA4 ecommerce setup, KPI definition, channel reporting, customer analysis, and a clear handover so the business can keep using the numbers after the consultant leaves.
What ecommerce analytics consulting should include
A good ecommerce analytics consultant starts with business questions, not charts. The work should clarify which decisions the store needs to make, which systems hold the data, and which numbers are currently too weak to trust. That is why ecommerce analytics consulting often begins with a measurement audit before anyone redesigns a dashboard.
For most ecommerce teams, the scope sits across five areas: measurement, data quality, reporting, analysis, and operating rhythm. Measurement covers GA4, Google Tag Manager, ecommerce events, ad pixels, consent settings, and server-side tracking where needed. Data quality covers duplicate orders, missing refunds, product naming issues, inconsistent campaign tags, and mismatched revenue between platforms. Reporting turns that cleaned-up data into useful dashboards. Analysis explains what changed and why. The operating rhythm defines who reviews the numbers and what action follows.
This is where many generic dashboards fall short. A dashboard can show revenue, conversion rate, and ROAS, but it cannot fix broken purchase events, unclear product margins, or ad platform numbers that do not reconcile with store revenue.
Ecommerce analytics consulting flow
Why ecommerce data often becomes unreliable
Ecommerce reporting breaks because the customer journey crosses too many tools. A shopper may click an ad, browse on mobile, sign up for email, come back through search, use a discount code, buy through the store, return one item, and purchase again through a campaign weeks later. Each system records part of that journey in its own way.
Consulting should reduce that uncertainty. It should not pretend every system will match perfectly, because platform differences are normal. The practical goal is to document the differences, fix preventable errors, and make the remaining gaps clear enough for decision-making.
Ecommerce Google Analytics consulting and GA4 tracking
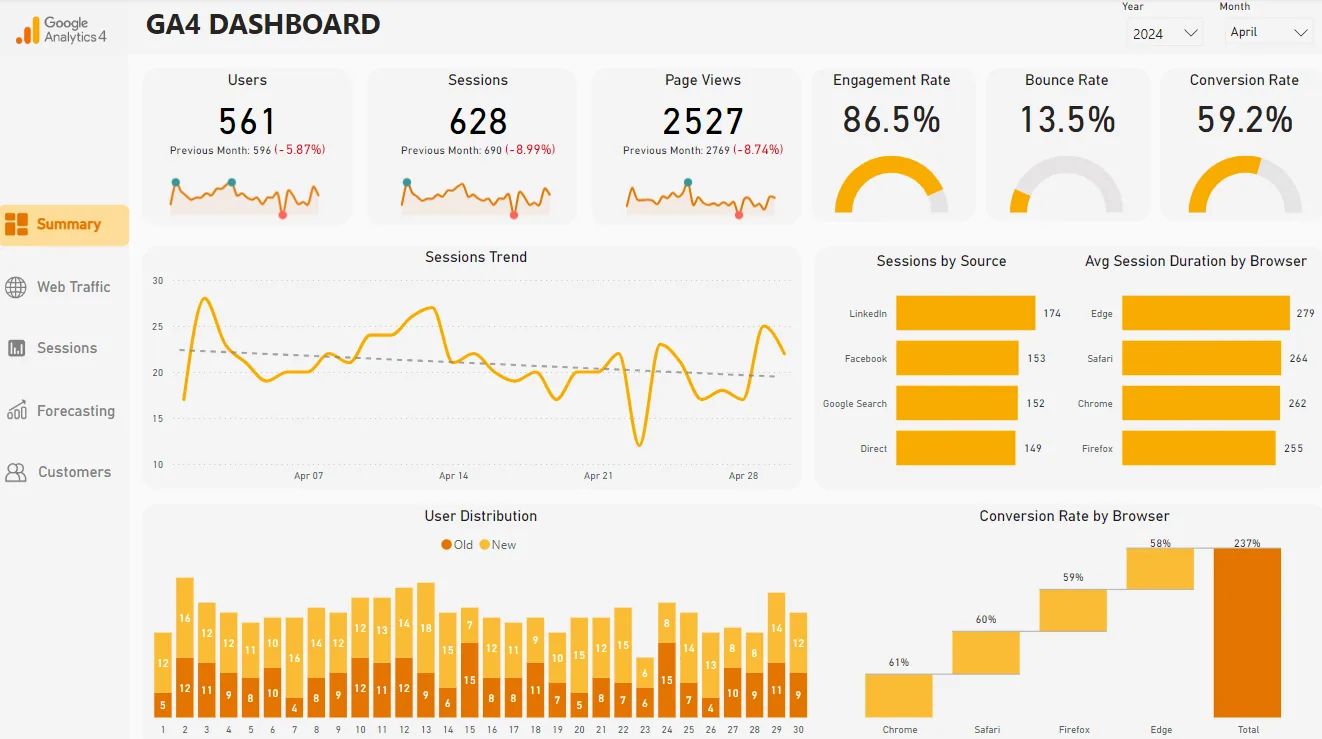
Ecommerce Google Analytics consulting usually starts with GA4 event quality. Google’s ecommerce measurement documentation describes events such as view_item, add_to_cart, begin_checkout, purchase, refund, select_promotion, and view_promotion. Those events only become useful when the store sends clean item IDs, names, categories, prices, quantities, currencies, transaction IDs, and revenue values.
The consultant should inspect the dataLayer, Google Tag Manager setup, GA4 event reports, debug views, conversion settings, and consent behaviour. If checkout is handled on another domain or payment provider, cross-domain and referral exclusion issues may also need attention. Where privacy rules apply, consent mode and tag behaviour should be reviewed with the right legal or privacy guidance.
GA4 should answer useful store questions: which products people view but do not add to cart, where checkout abandonment happens, which promotions influence purchases, and whether repeat buyers behave differently from new customers. If those answers are unclear, a dashboard built on top of GA4 will only make bad data look cleaner.
The metrics an ecommerce consultant should help you trust
The point is not to track every possible number. The point is to choose a small set of metrics that connect to real decisions.
| Metric | What it helps decide | Common data risk |
|---|---|---|
| Conversion rate | Whether traffic quality, landing pages, checkout, or offer fit needs work. | Sessions and purchases may come from different attribution windows or consent states. |
| Average order value | Whether bundles, thresholds, cross-sells, and promotions are changing basket value. | Refunds, discounts, shipping, and taxes may be treated differently across systems. |
| Customer acquisition cost | Whether paid channels can scale profitably. | Ad spend and order attribution can disagree between ad platforms and analytics tools. |
| ROAS | Whether campaigns, audiences, and creatives deserve more or less budget. | Platform-reported ROAS may over-credit campaigns or ignore margin and refunds. |
| Repeat purchase rate | Whether retention, email, loyalty, product quality, or replenishment work is paying off. | Guest checkout, email changes, and duplicated customer profiles can distort cohorts. |
| Product data quality | Whether product-level reporting is reliable enough for merchandising decisions. | Product names, variants, bundles, and category mappings may not be consistent. |
If you are planning a Power BI reporting layer, MSI’s Power BI KPI dashboard guide explains how to connect KPIs to decisions before building pages.
What a good ecommerce analytics engagement should deliver
A useful engagement should leave the business with more than a report file. It should leave clear definitions, reliable tracking, documented assumptions, and a way to keep improving the reporting.
- Measurement audit. Check GA4, Google Tag Manager, ecommerce events, ad pixels, consent behaviour, transaction IDs, product fields, refunds, and attribution settings.
- KPI definition sheet. Agree how revenue, orders, refunds, conversion rate, customer acquisition cost, repeat purchase, gross margin, and ROAS should be calculated.
- Data model or reporting layer. Bring store, marketing, customer, and product data into a structure that can support dashboards and analysis.
- Dashboard build. Create pages for leadership, marketing, merchandising, retention, and operations only where those views support real decisions.
- Insight process. Define what gets reviewed weekly or monthly, who owns each metric, and what action should follow.
- Handover. Document sources, refresh rules, known limitations, ownership, and how the team should maintain the setup.
Dashboard examples by team
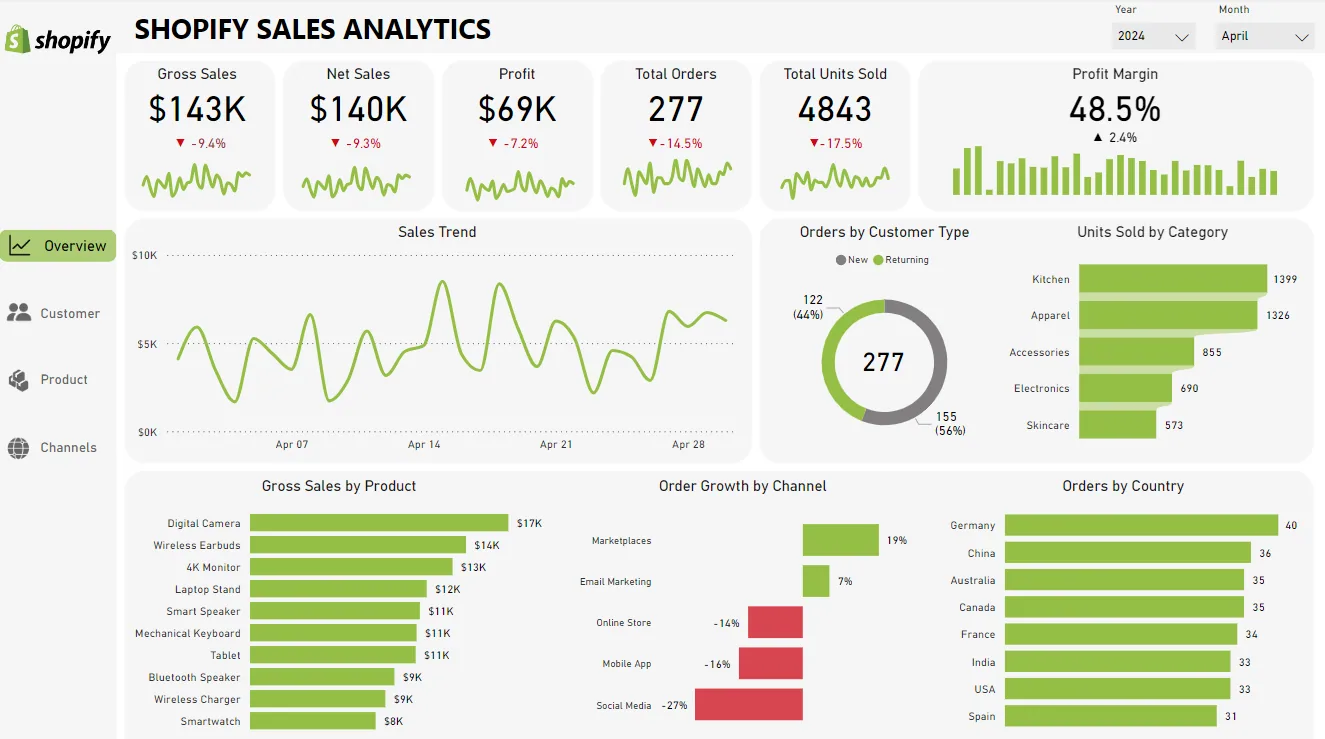
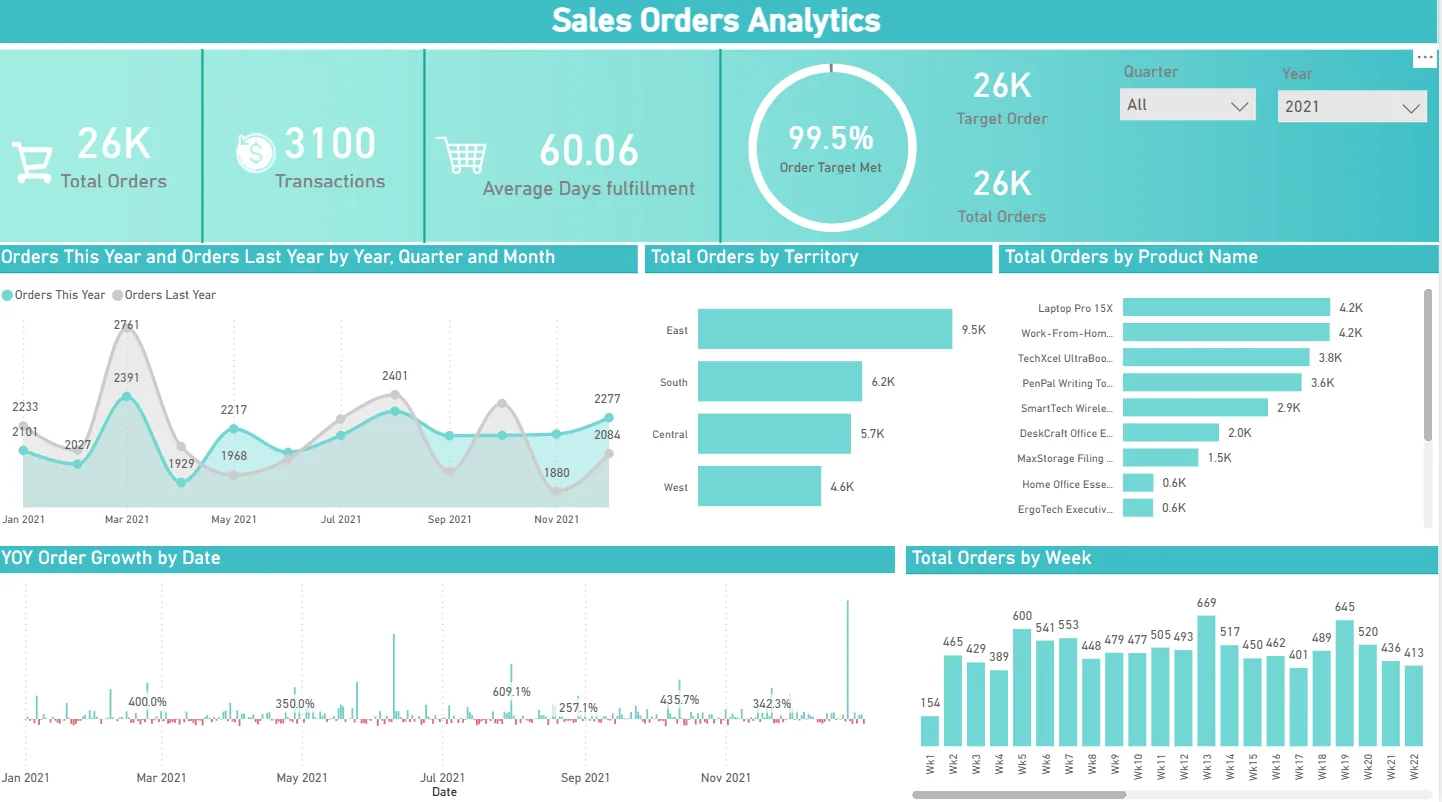
Different teams need different cuts of ecommerce performance. Leadership needs the big picture. Marketing needs channel and campaign clarity. Merchandising needs product and category movement. Retention teams need customer behaviour. Operations needs fulfilment, refunds, and stock signals.
| Team | Useful dashboard view | Decision it supports |
|---|---|---|
| Leadership | Revenue, orders, margin, conversion, new vs returning customers, channel mix. | Where growth is coming from and what needs attention this week. |
| Marketing | Spend, CAC, ROAS, assisted revenue, landing-page conversion, campaign quality. | Which channels and campaigns deserve budget changes. |
| Merchandising | SKU sales, category trends, inventory cover, returns, bundles, discount use. | Which products to promote, restock, bundle, or retire. |
| Retention | Cohorts, repeat purchase, email revenue, churn signals, LTV, customer segments. | Which customers need win-back, replenishment, or loyalty work. |
| Operations | Order backlog, fulfilment time, refund rate, cancellation rate, stock exceptions. | Where service issues may damage revenue or repeat purchase. |
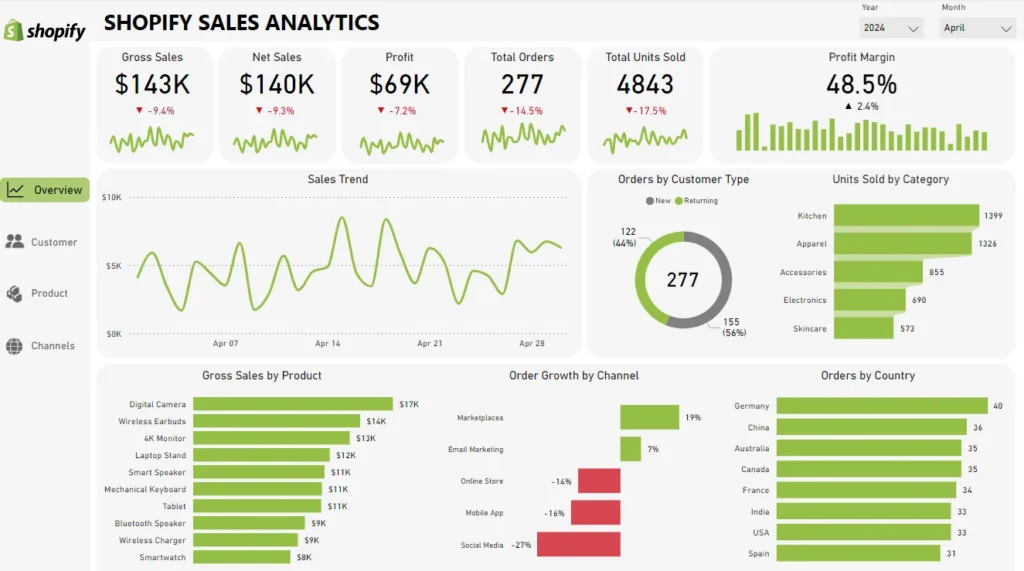
For visual inspiration, browse MSI’s Power BI KPI dashboard examples. The ecommerce examples are most useful when adapted to your own store model, not copied as a generic layout.
When to hire an ecommerce analytics consultant
Consulting makes sense when decisions are being delayed or made from numbers the team does not trust. It is especially useful when paid spend is rising, GA4 was migrated or rebuilt recently, checkout tracking has changed, or the business is expanding into new channels.
You may not need a full consulting engagement if the issue is small and obvious. A simple dashboard cleanup may be enough when tracking is already reliable, KPI definitions are agreed, and the team only needs a clearer view. A deeper engagement is better when the same revenue, ROAS, or customer number changes depending on which platform someone opens.
Small teams may also benefit from a lighter reporting setup before moving into a data warehouse. MSI’s small business dashboard guide covers how to keep early reporting practical before the system becomes too heavy.
Questions to ask before hiring a consultant
- Which ecommerce platforms, analytics tools, and ad platforms have you worked with?
- How do you test GA4 ecommerce events before dashboards are built?
- How will you handle refunds, cancellations, discounts, taxes, shipping, and product variants?
- What will be documented for our internal team?
- Will we own the data model, dashboards, tags, and source connections after the work is complete?
- How do you explain differences between GA4, Shopify, ad platforms, and finance reports?
- What happens after launch if tracking breaks or new campaigns are added?
Common mistakes to avoid
The most expensive analytics mistake is optimising from inaccurate purchase data. If purchase events duplicate, refunds are ignored, or product fields are inconsistent, campaign and product decisions can look more precise than they are.
Another mistake is relying only on blended ROAS. Blended ROAS can be useful for a high-level view, but it can hide channel mix, customer quality, margin, repeat purchase, and product-level problems. Ecommerce leaders usually need a more balanced view before moving budget.
Finally, avoid dashboards built before decisions are defined. A report that shows everything often changes nothing. A better report makes a smaller number of important decisions easier to make.
Frequently asked questions
What does ecommerce analytics consulting include?
It usually includes a tracking audit, GA4 or tag setup review, KPI definitions, dashboard design, channel reporting, customer analysis, attribution review, documentation, and handover. The exact scope should depend on the business decisions you need to improve.
Is GA4 enough for ecommerce analytics?
GA4 is important, but it is rarely enough on its own. Store data, ad spend, email data, customer records, product margins, refunds, and fulfilment data often need to be combined before the business can make confident decisions.
Do ecommerce stores need Power BI?
Power BI is useful when the store needs governed reporting across several sources, such as GA4, Shopify, ads, CRM, finance, and operations. Smaller stores may start with GA4 and platform reports, then move into Power BI when questions become more cross-functional.
How do I know if my tracking is wrong?
Common signs include revenue mismatches that nobody can explain, missing checkout events, duplicate purchases, campaign tags that change by channel, product names that do not match across systems, and dashboards that disagree with finance reports.
Sources and further reading: Google Analytics ecommerce measurement; Google Analytics recommended events; Google Consent Mode documentation; Microsoft Power Query Google Analytics connector.
Related reading