
Dashboard examples
Power BI KPI Dashboard Examples with 30+ Real Dashboard Ideas
Browse Power BI dashboard examples across sales, finance, marketing, operations, HR, healthcare, ecommerce, and service reporting.
These Power BI KPI dashboard examples show how different teams can track goals, trends, and operational exceptions in one place. Use them as inspiration for structure and KPI selection, then adapt the design to your own data model and decision process.
Use this gallery to compare layouts, KPI choices, and drill paths across different teams. Start by identifying the decision the dashboard must support, then adapt the most relevant pattern to your own data and users.
How to use these examples
Do not copy a dashboard only because it looks polished. First identify the business question, then select KPIs, then design the page. A sales dashboard, for example, should make pipeline risk obvious. A finance dashboard should make cash, margin, and variance easy to inspect. An operations dashboard should surface bottlenecks and exceptions quickly.
Sales and ecommerce dashboard examples
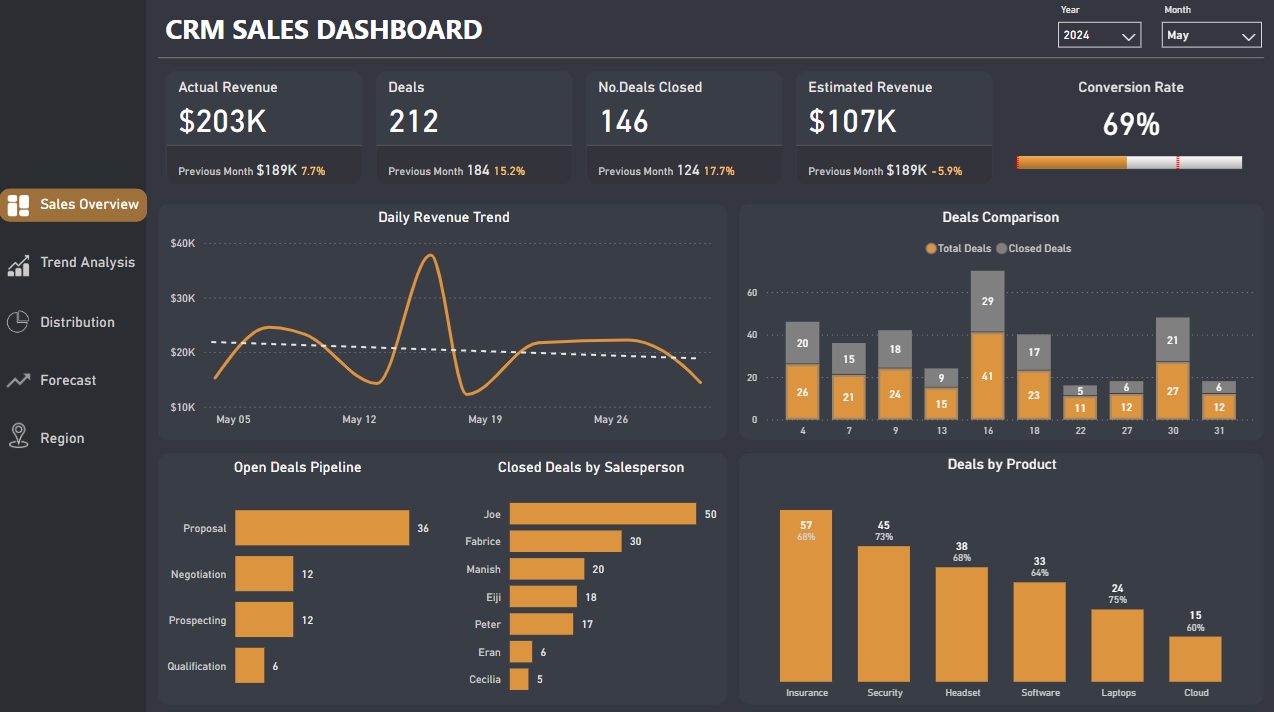
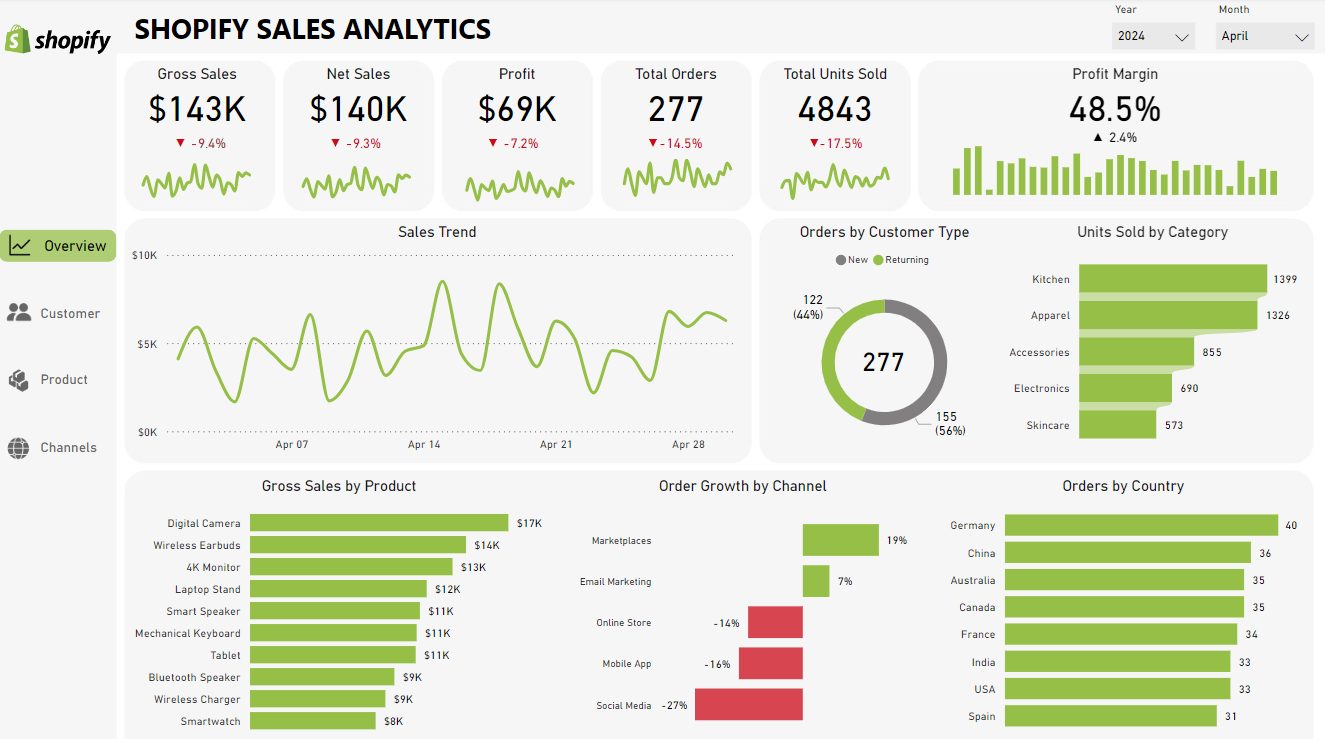
Sales and ecommerce dashboards usually combine revenue, conversion, product, channel, customer, and pipeline KPIs. Strong pages let leaders move from headline performance to source, product, owner, or campaign detail.
Marketing dashboard examples
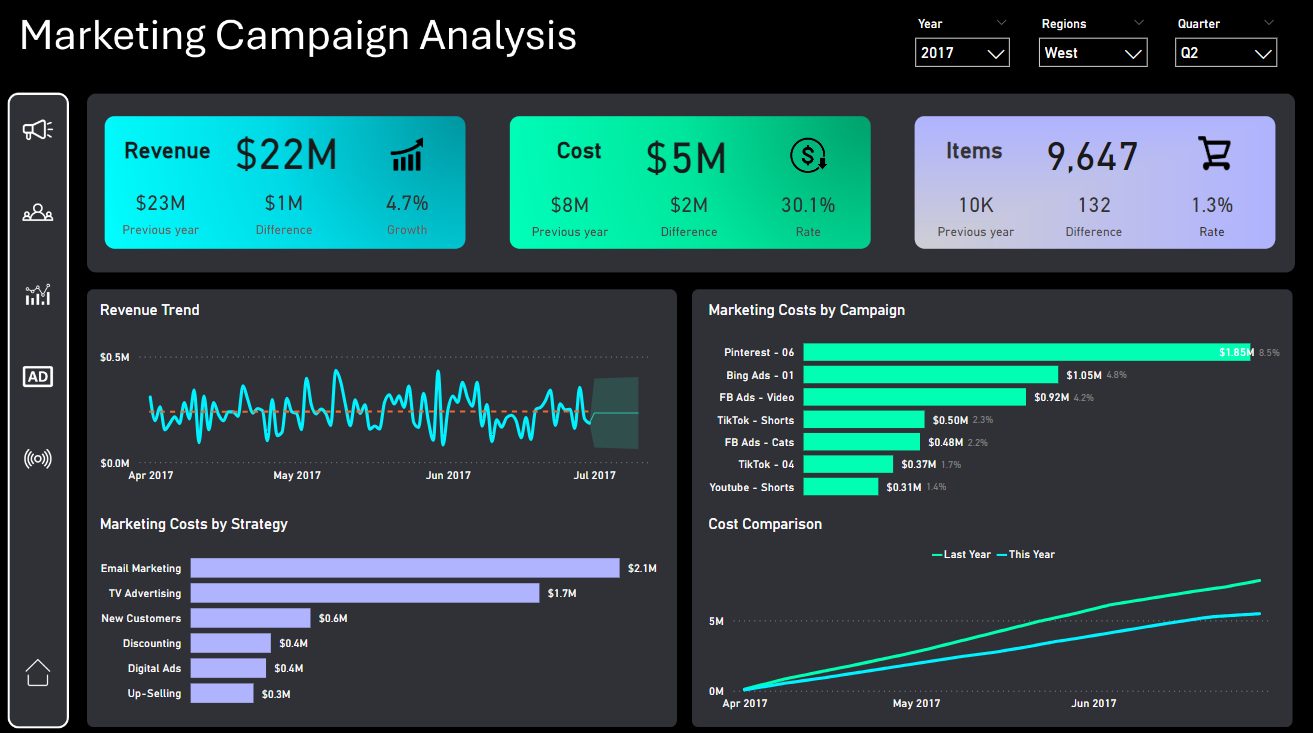
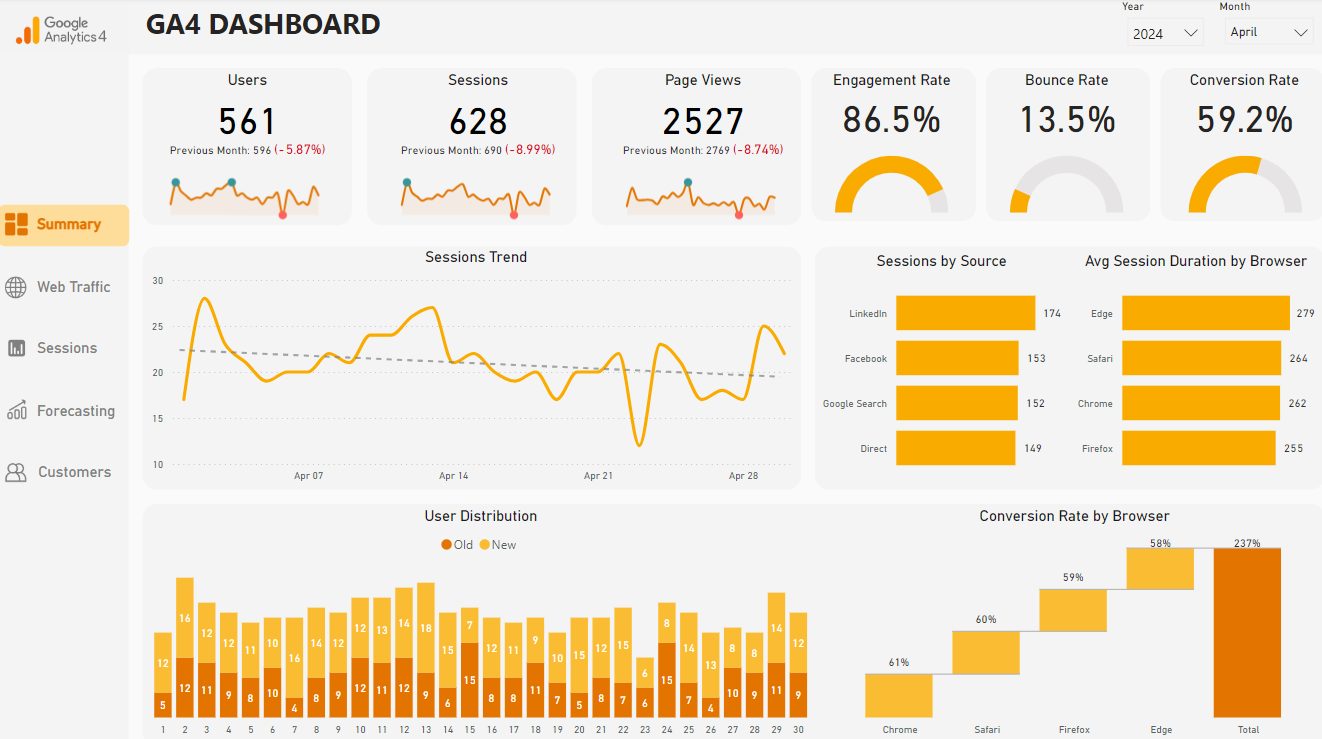
Marketing KPI dashboards should connect spend, traffic, conversion, and revenue. The most useful versions avoid vanity metrics and help teams decide where budget should move next.
Operations dashboard examples
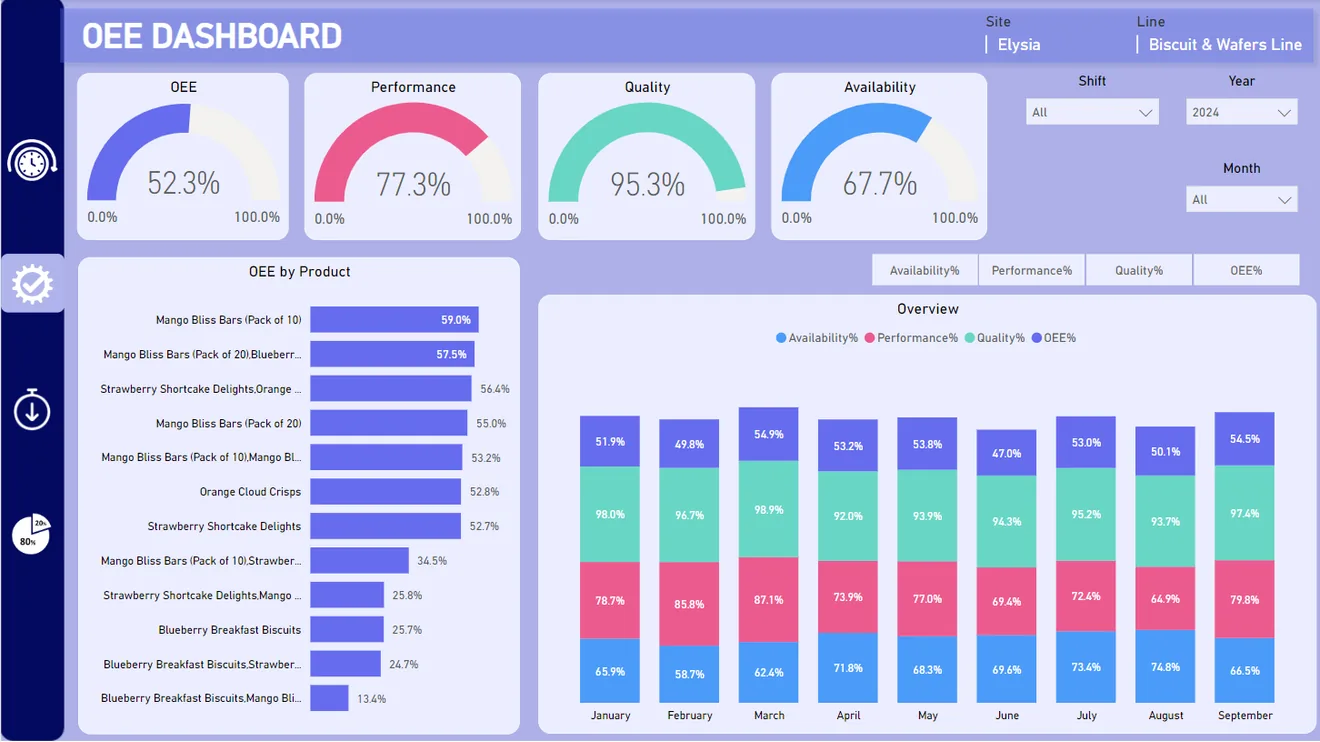
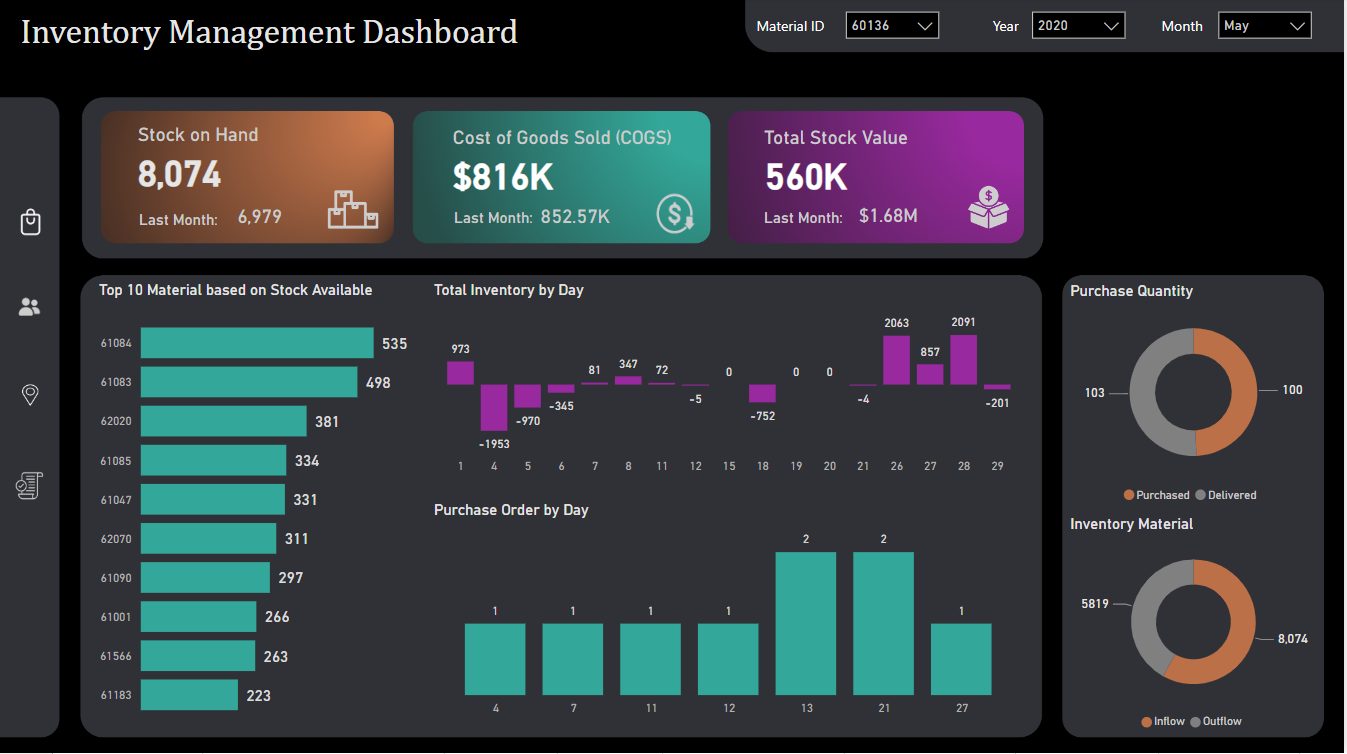
Operations dashboards focus on throughput, backlog, cycle time, service levels, utilisation, and quality. They are most valuable when they show exceptions early enough for a manager to act.
Finance dashboard examples
Finance dashboards need careful definitions because users rely on them for management reporting. Tie every KPI to a trusted model and document revenue, margin, cash, and variance rules.
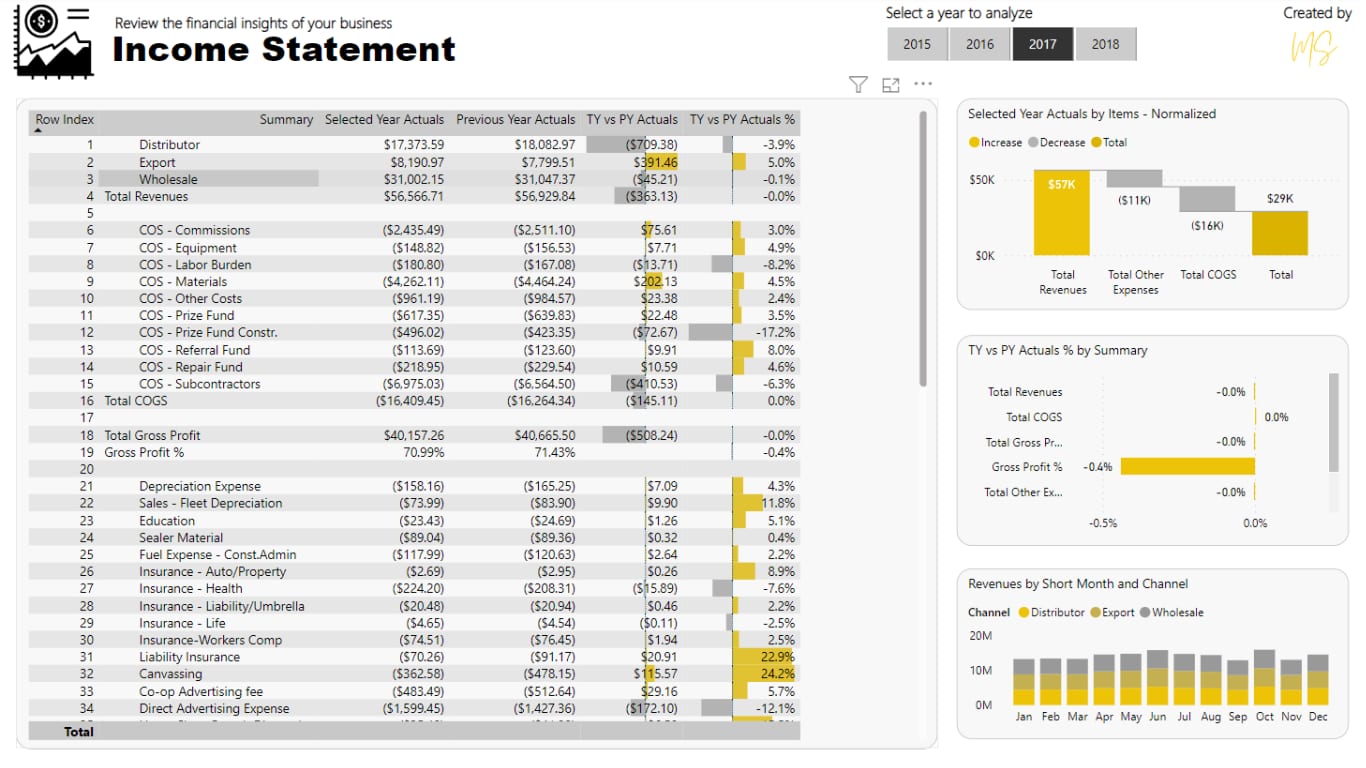
For a deeper finance-focused article, see MSI’s guide to financial dashboards in Power BI.
People and service dashboard examples
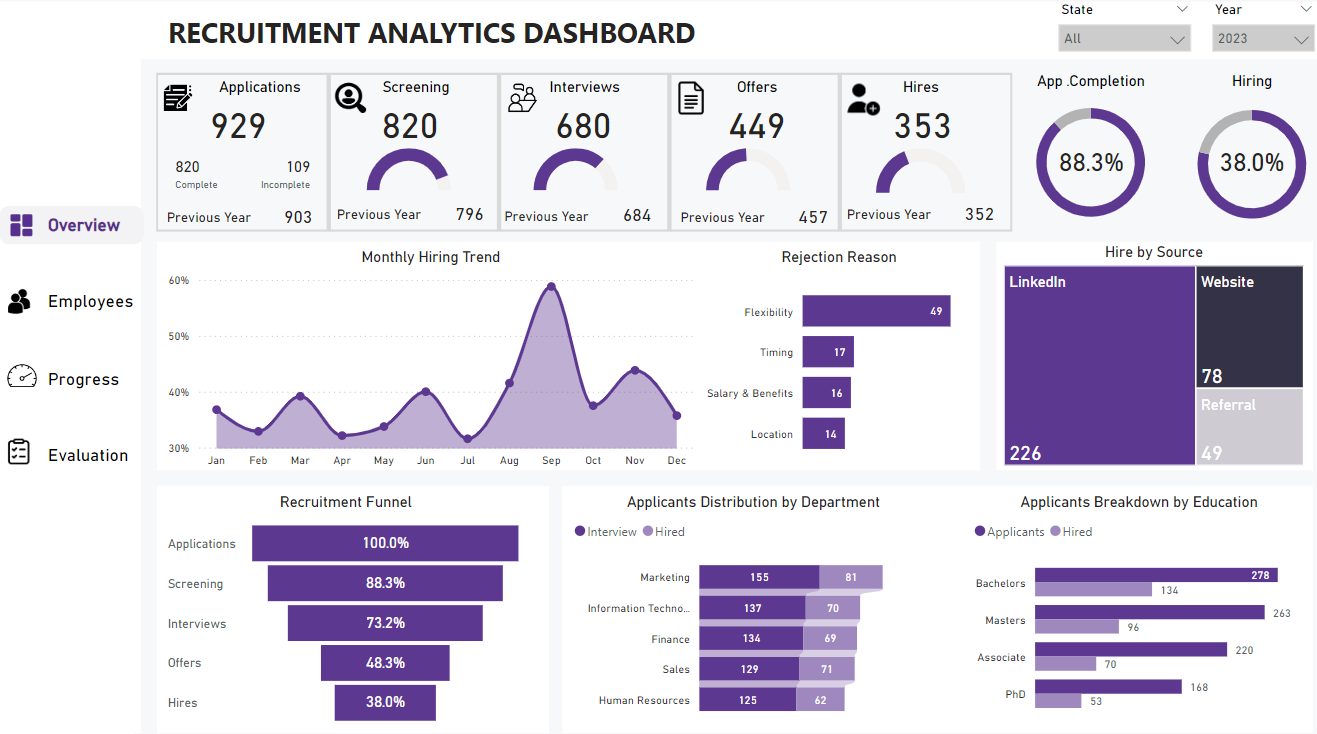
HR, recruitment, customer care, and healthcare dashboards usually work best when they blend headline KPIs with queue, trend, and exception views.
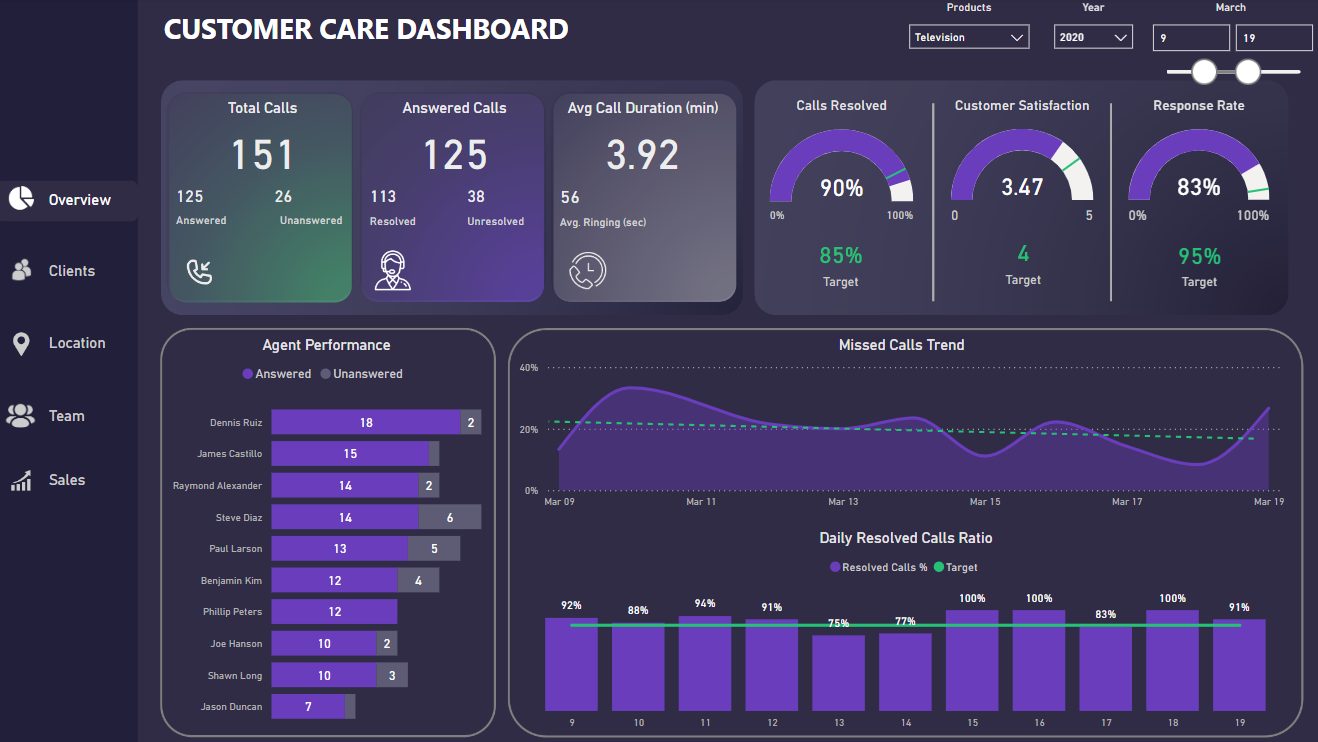
Full Power BI KPI dashboard example gallery
Amazon Sales & Traffic Dashboard
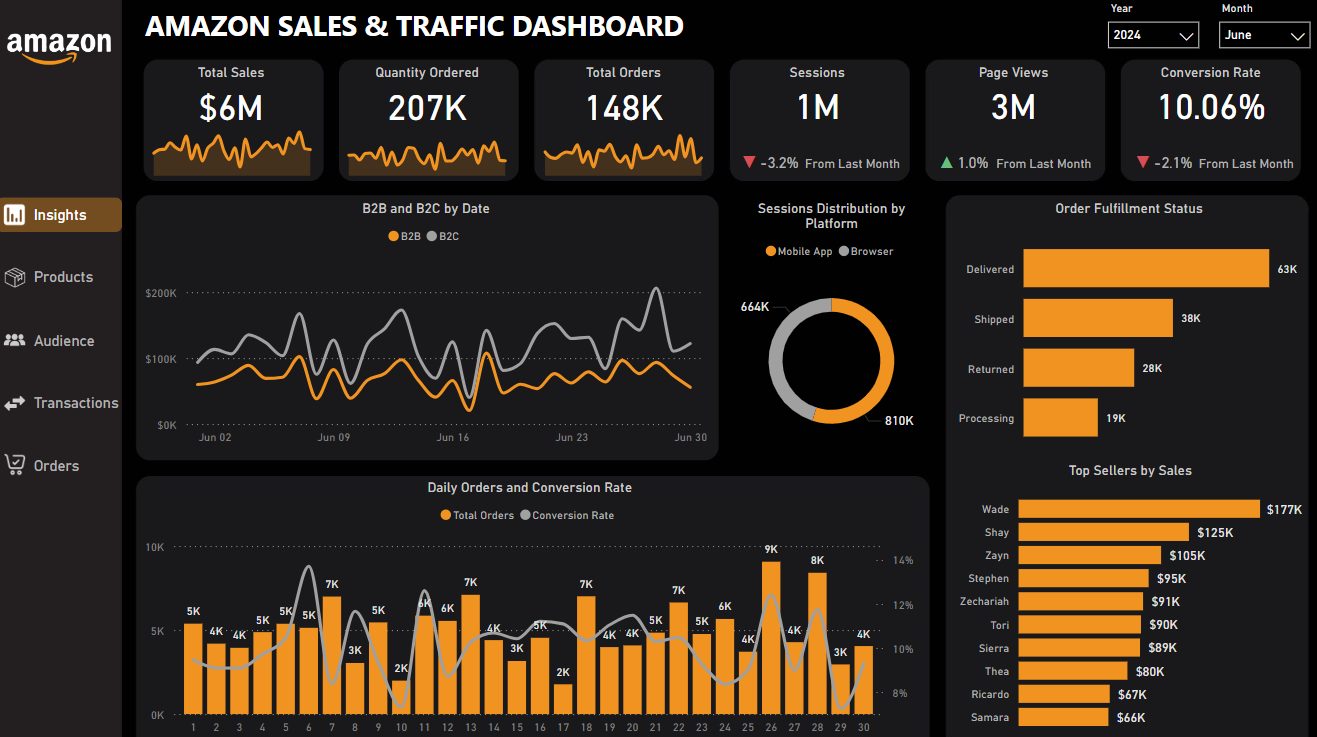
This dashboard pattern is useful for monitoring performance, spotting exceptions, and giving managers a shared KPI view. Typical KPIs may include volume, value, rate, trend, target variance, backlog, conversion, or quality measures depending on the data source.
Consulting Service Dashboard
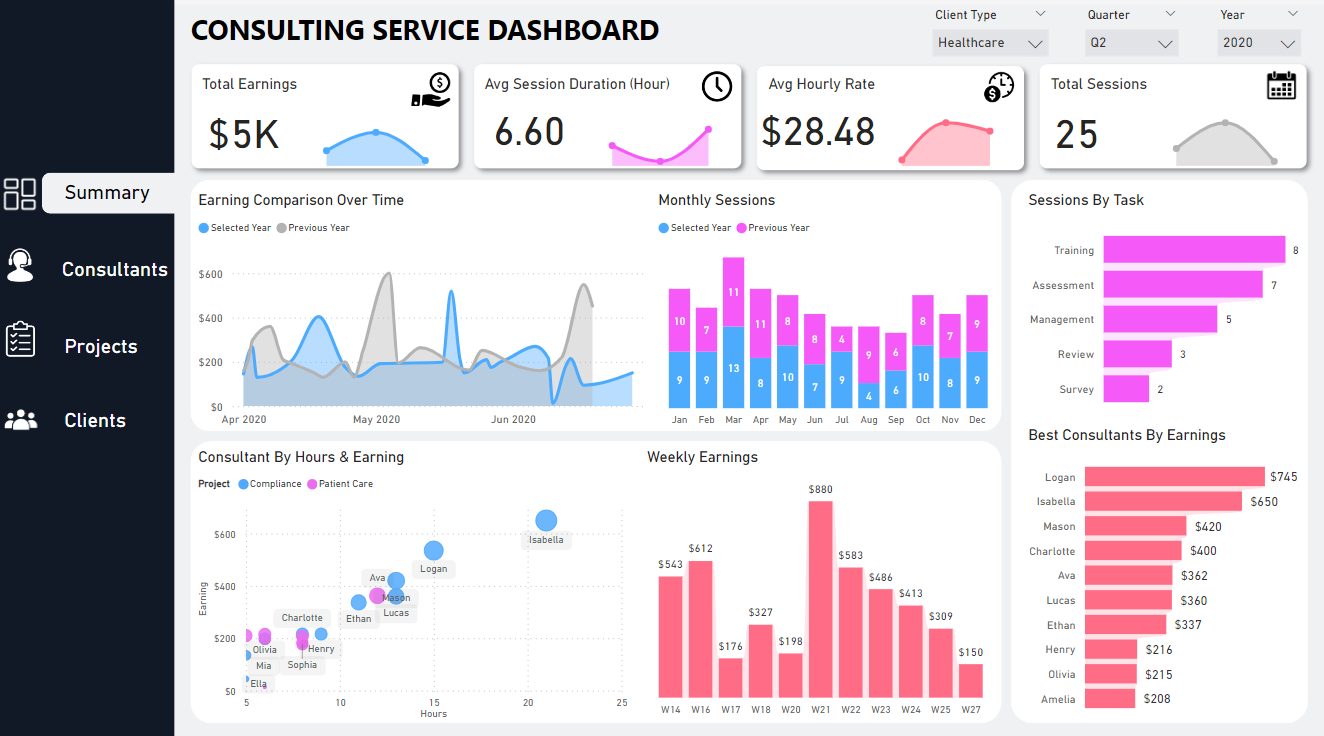
This dashboard pattern is useful for monitoring performance, spotting exceptions, and giving managers a shared KPI view. Typical KPIs may include volume, value, rate, trend, target variance, backlog, conversion, or quality measures depending on the data source.
Environmental Health Dashboard
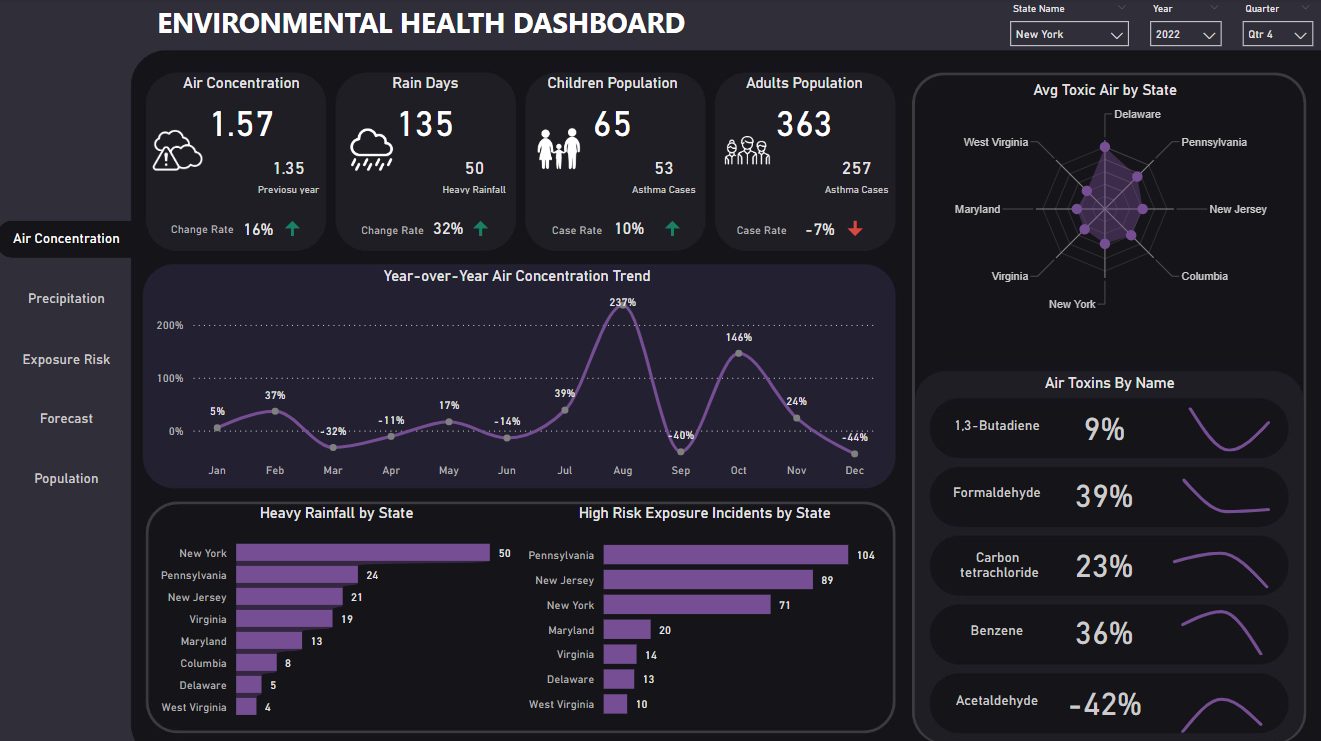
This dashboard pattern is useful for monitoring performance, spotting exceptions, and giving managers a shared KPI view. Typical KPIs may include volume, value, rate, trend, target variance, backlog, conversion, or quality measures depending on the data source.
Product Performance Dashboard
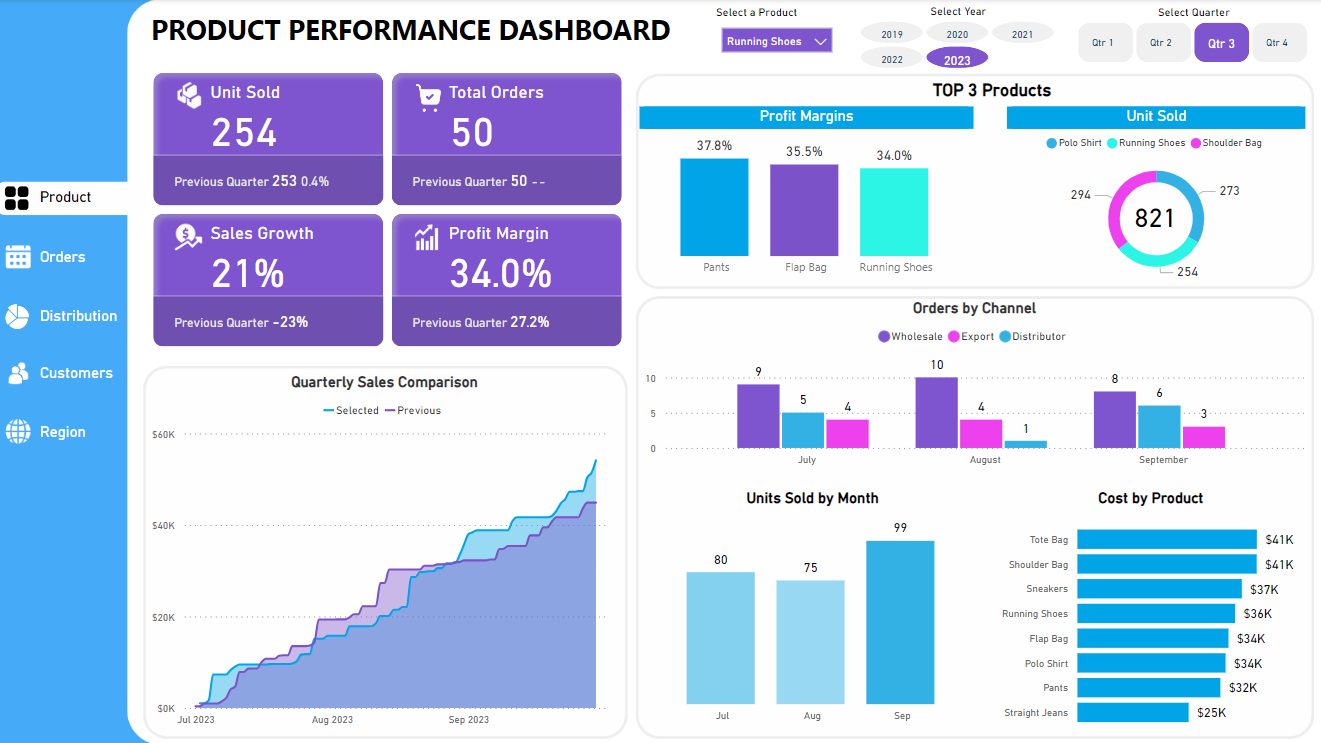
This dashboard pattern is useful for monitoring performance, spotting exceptions, and giving managers a shared KPI view. Typical KPIs may include volume, value, rate, trend, target variance, backlog, conversion, or quality measures depending on the data source.
Procurement Analysis Dashboard
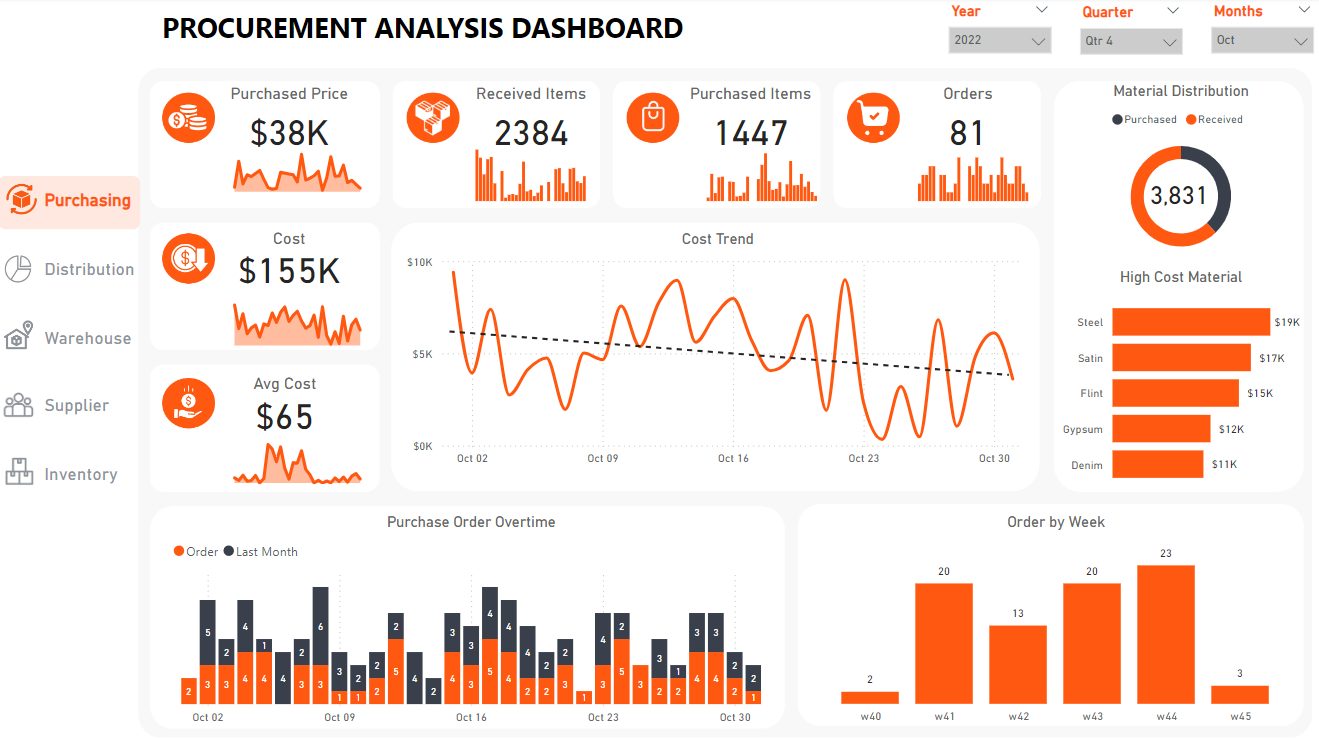
This dashboard pattern is useful for monitoring performance, spotting exceptions, and giving managers a shared KPI view. Typical KPIs may include volume, value, rate, trend, target variance, backlog, conversion, or quality measures depending on the data source.
Customer Care Dashboard
This dashboard pattern is useful for monitoring performance, spotting exceptions, and giving managers a shared KPI view. Typical KPIs may include volume, value, rate, trend, target variance, backlog, conversion, or quality measures depending on the data source.
Google Analytics 4 Dashboard
This dashboard pattern is useful for monitoring performance, spotting exceptions, and giving managers a shared KPI view. Typical KPIs may include volume, value, rate, trend, target variance, backlog, conversion, or quality measures depending on the data source.
Financial Analytics Dashboard
This dashboard pattern is useful for monitoring performance, spotting exceptions, and giving managers a shared KPI view. Typical KPIs may include volume, value, rate, trend, target variance, backlog, conversion, or quality measures depending on the data source.
Stock Market Analysis Dashboard
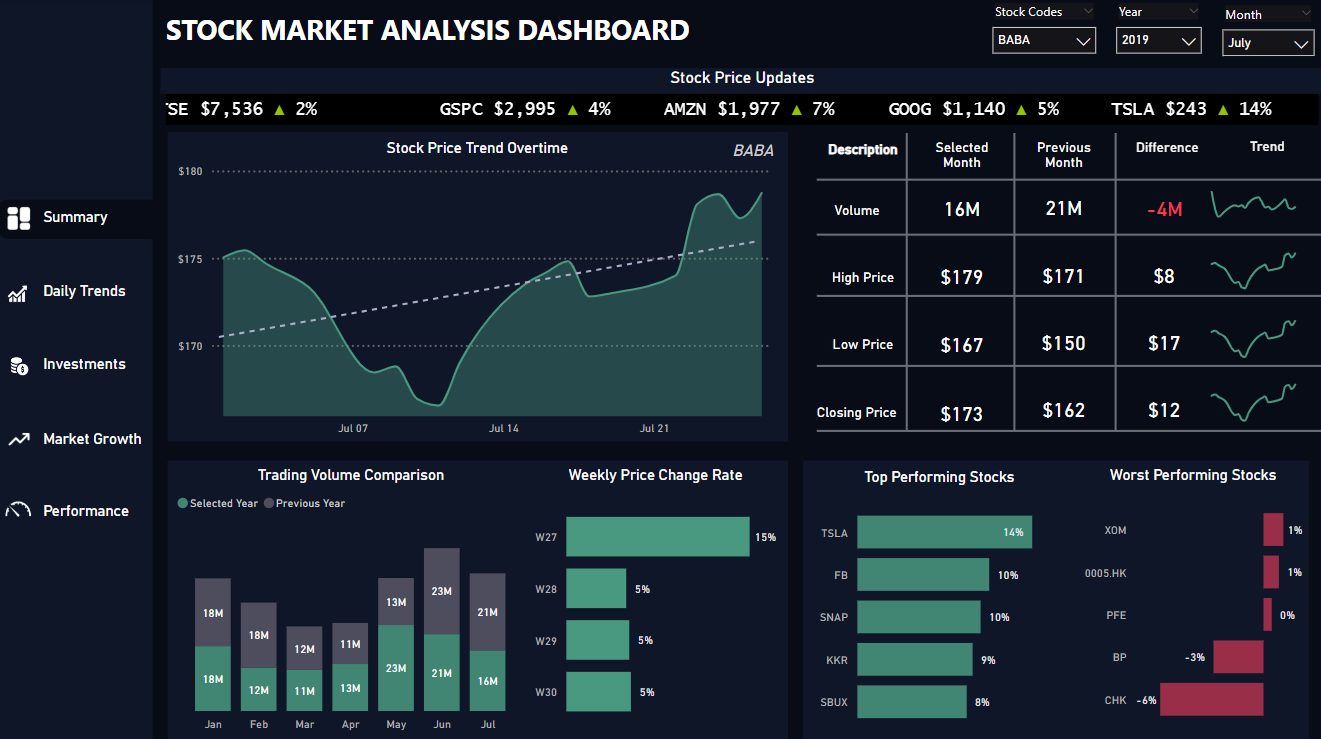
This dashboard pattern is useful for monitoring performance, spotting exceptions, and giving managers a shared KPI view. Typical KPIs may include volume, value, rate, trend, target variance, backlog, conversion, or quality measures depending on the data source.
Airbnb Dashboard
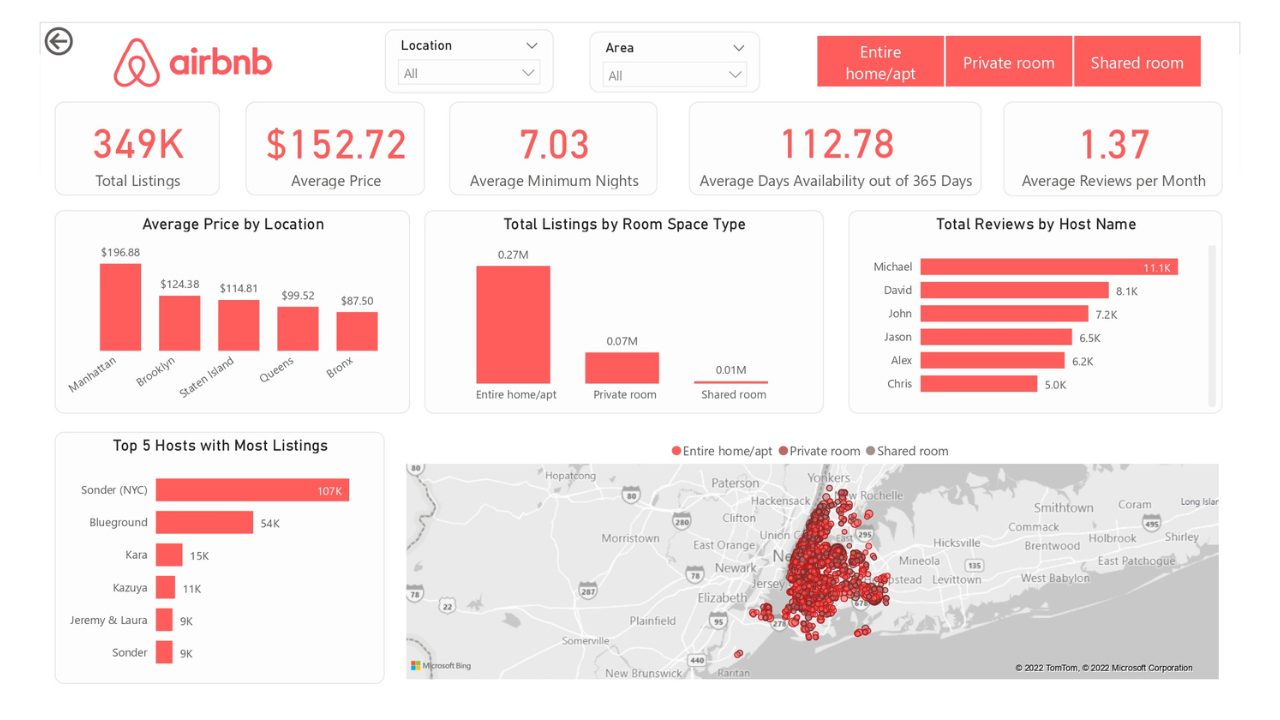
This dashboard pattern is useful for monitoring performance, spotting exceptions, and giving managers a shared KPI view. Typical KPIs may include volume, value, rate, trend, target variance, backlog, conversion, or quality measures depending on the data source.
Complaint Management Dashboard
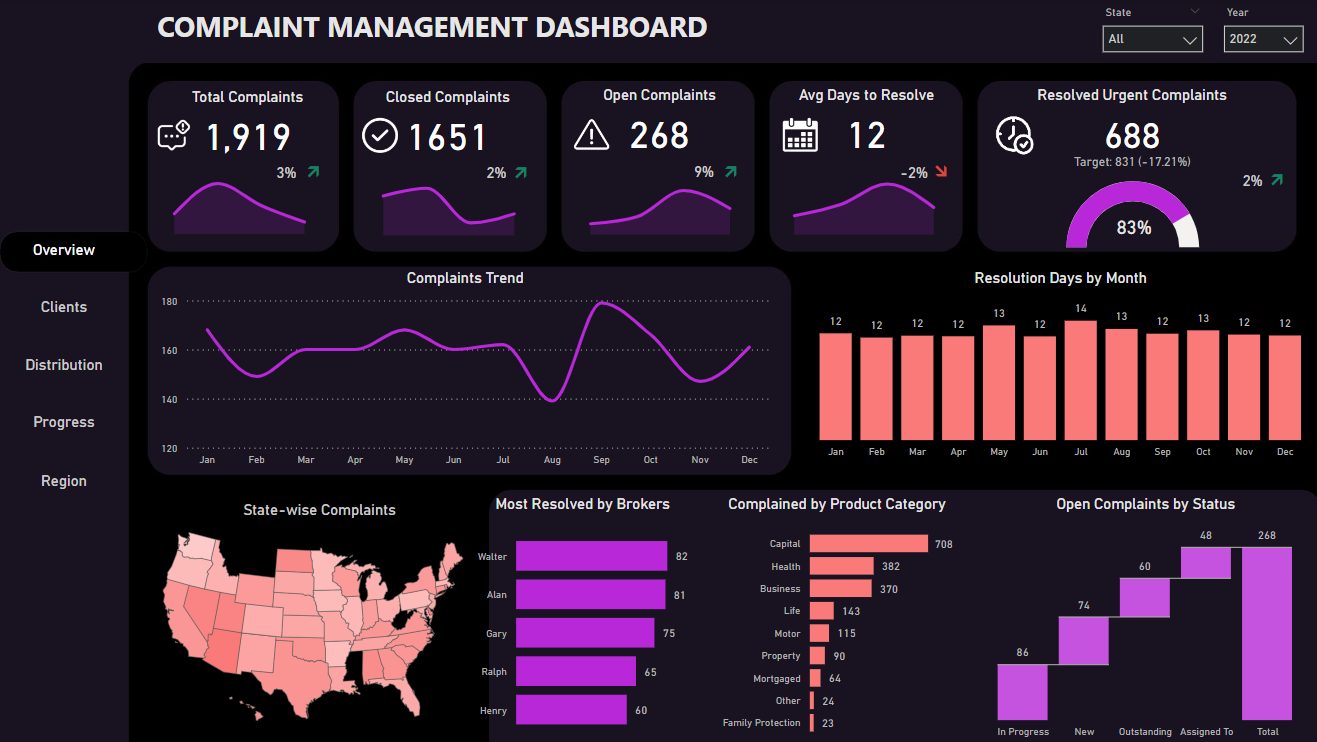
This dashboard pattern is useful for monitoring performance, spotting exceptions, and giving managers a shared KPI view. Typical KPIs may include volume, value, rate, trend, target variance, backlog, conversion, or quality measures depending on the data source.
IT Help Desk Dashboard
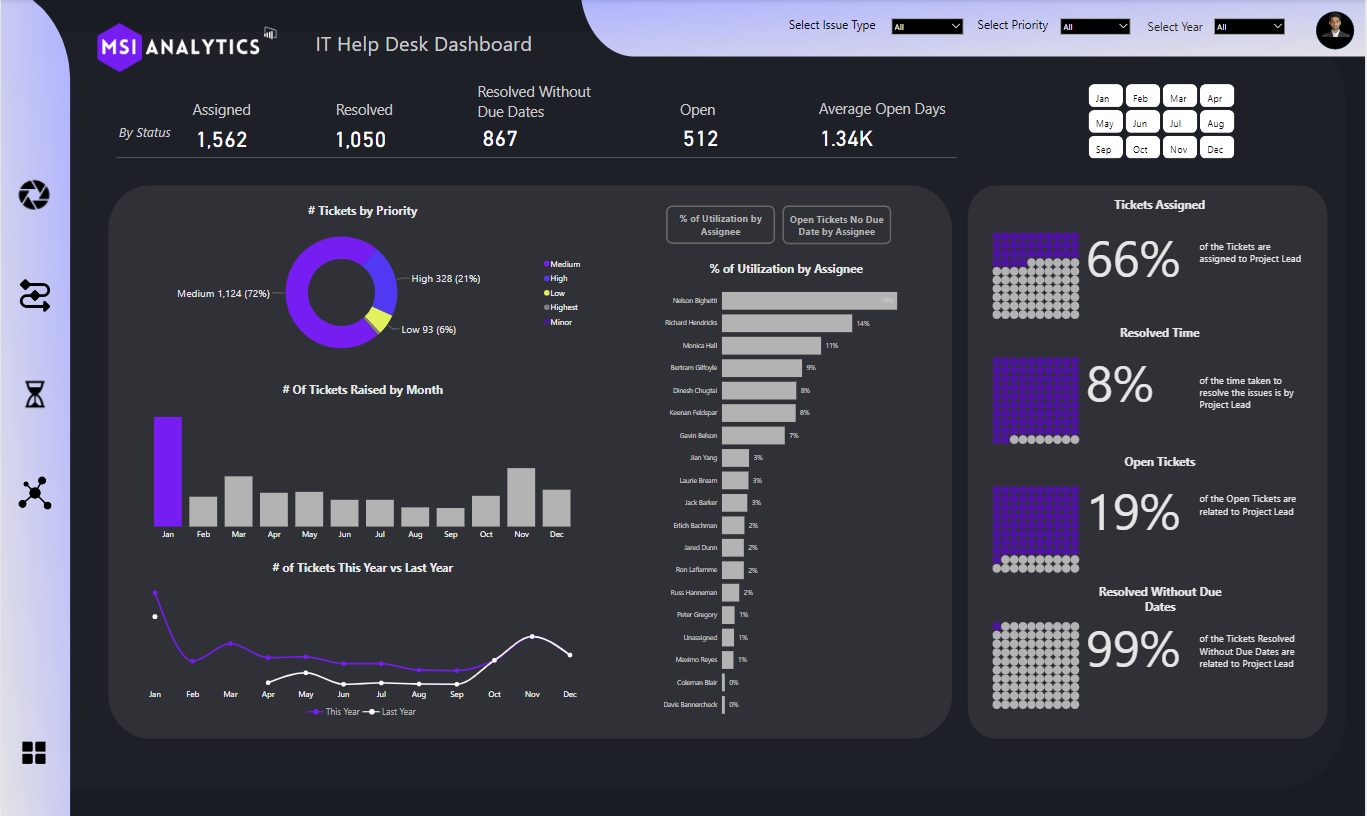
This dashboard pattern is useful for monitoring performance, spotting exceptions, and giving managers a shared KPI view. Typical KPIs may include volume, value, rate, trend, target variance, backlog, conversion, or quality measures depending on the data source.
Hospital Emergency Dashboard
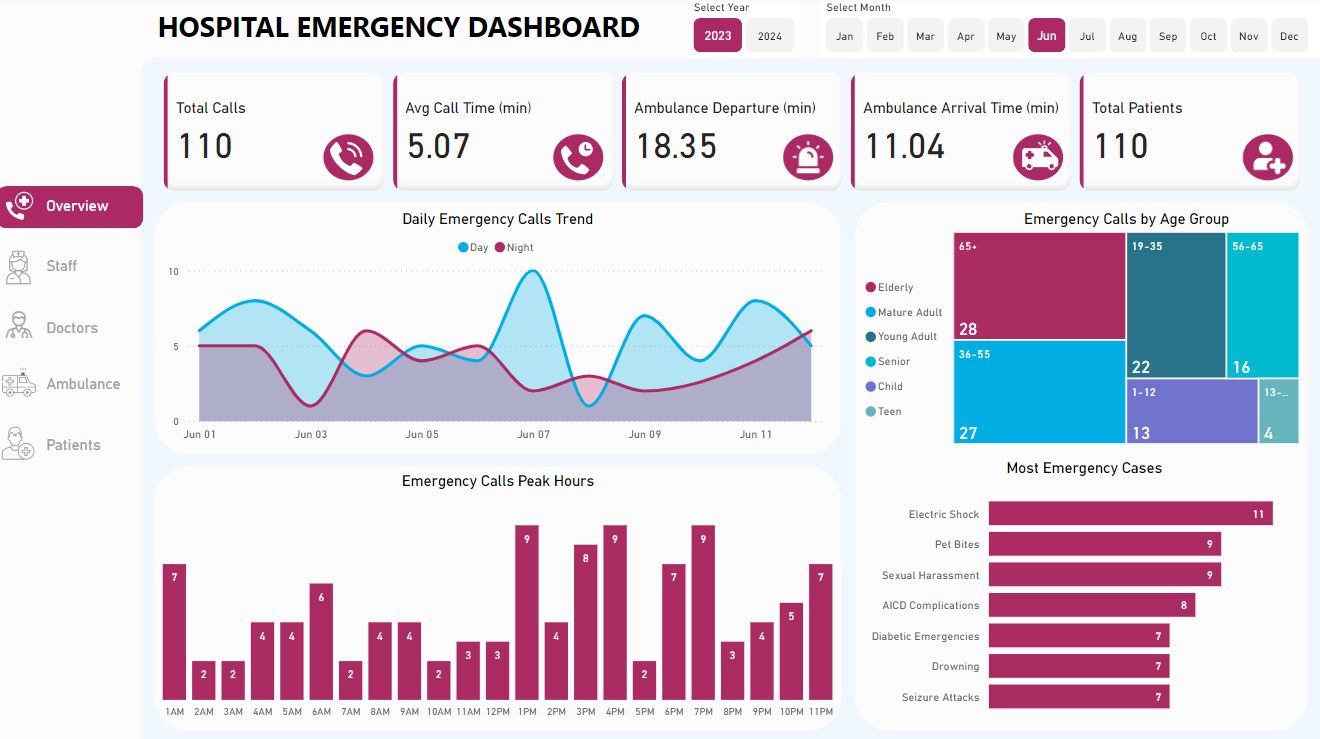
This dashboard pattern is useful for monitoring performance, spotting exceptions, and giving managers a shared KPI view. Typical KPIs may include volume, value, rate, trend, target variance, backlog, conversion, or quality measures depending on the data source.
People Analytics Dashboard
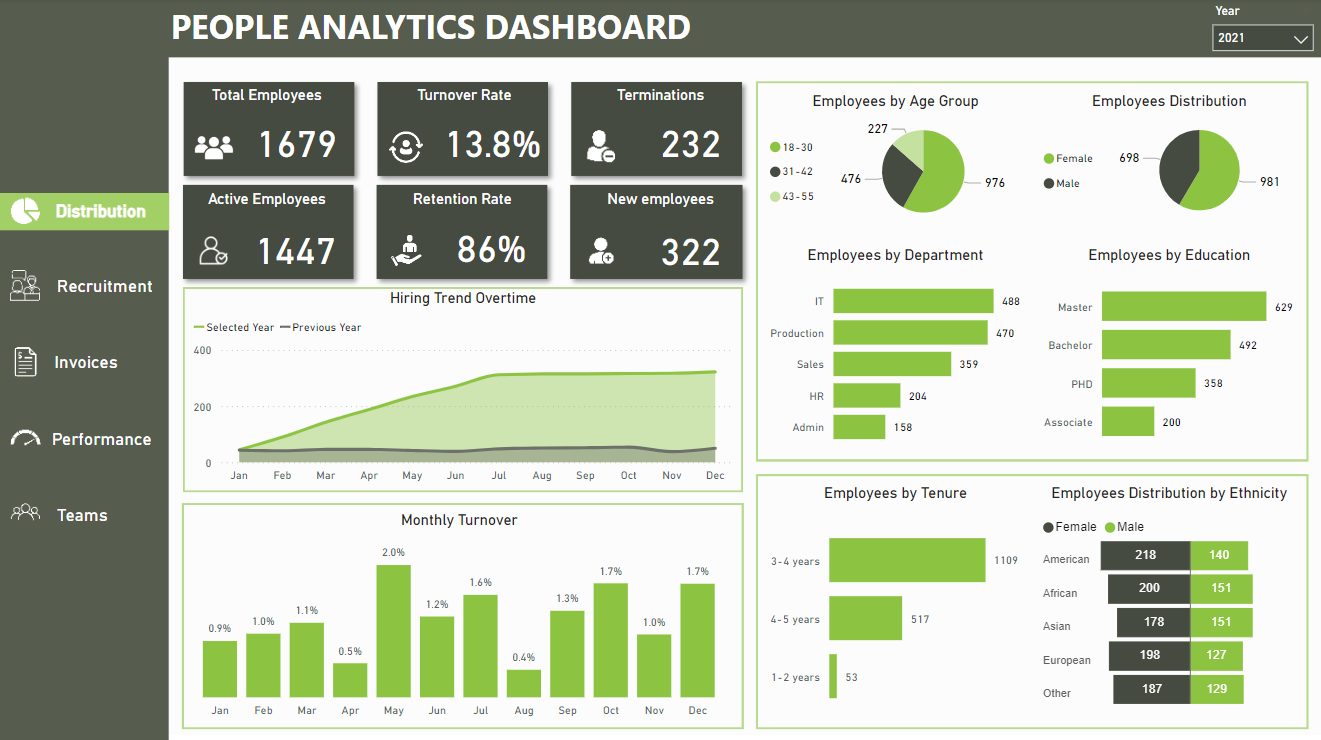
This dashboard pattern is useful for monitoring performance, spotting exceptions, and giving managers a shared KPI view. Typical KPIs may include volume, value, rate, trend, target variance, backlog, conversion, or quality measures depending on the data source.
CRM Sales Dashboard
This dashboard pattern is useful for monitoring performance, spotting exceptions, and giving managers a shared KPI view. Typical KPIs may include volume, value, rate, trend, target variance, backlog, conversion, or quality measures depending on the data source.
Supplier Risk Analysis Dashboard
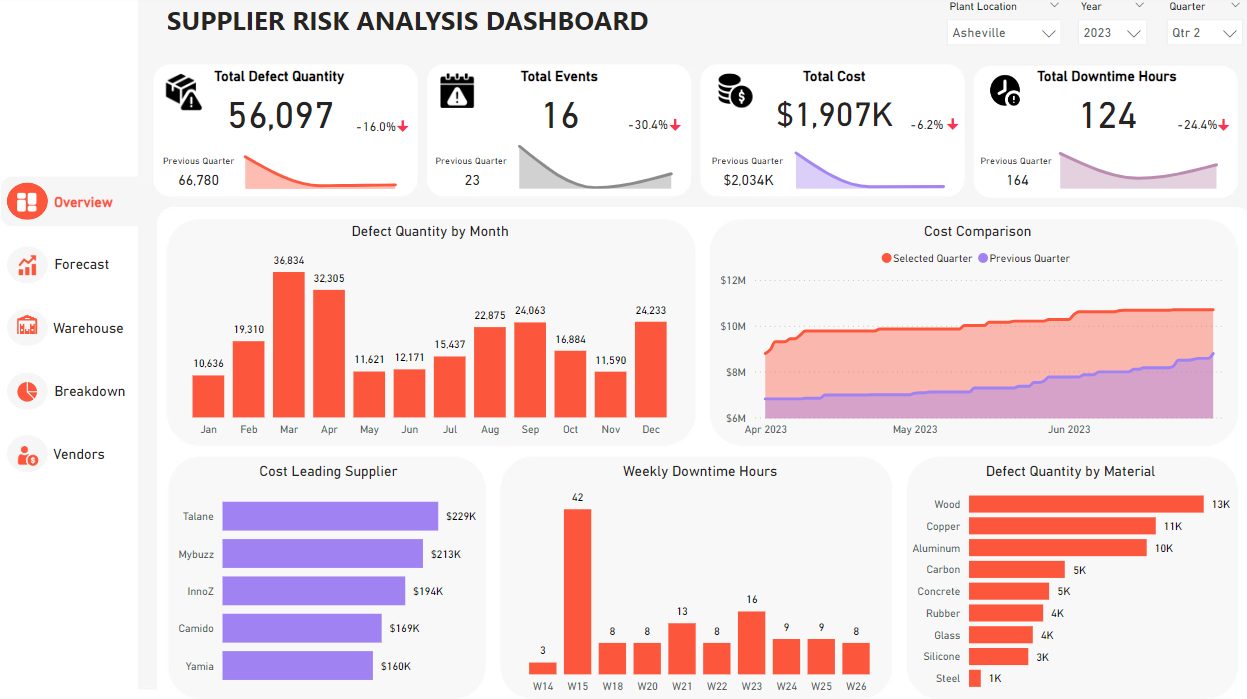
This dashboard pattern is useful for monitoring performance, spotting exceptions, and giving managers a shared KPI view. Typical KPIs may include volume, value, rate, trend, target variance, backlog, conversion, or quality measures depending on the data source.
Salesforce Leads Analytics Dashboard
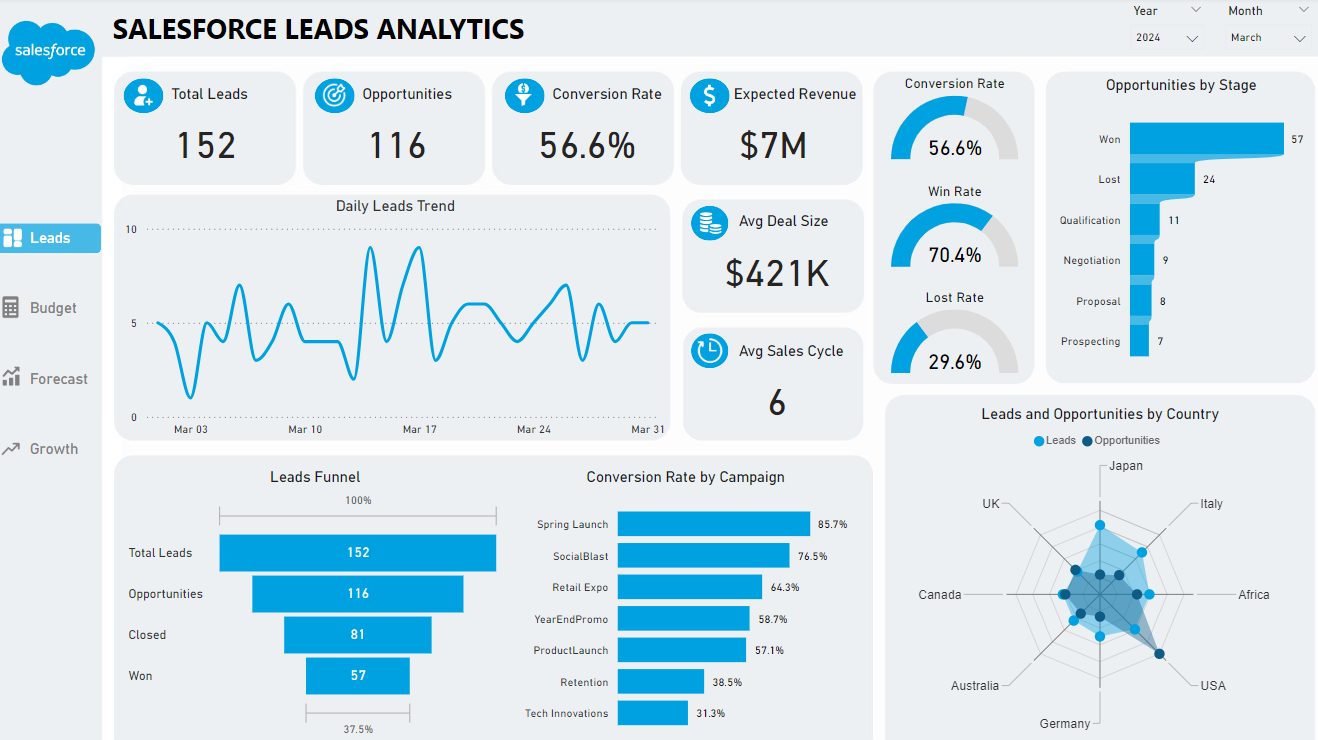
This dashboard pattern is useful for monitoring performance, spotting exceptions, and giving managers a shared KPI view. Typical KPIs may include volume, value, rate, trend, target variance, backlog, conversion, or quality measures depending on the data source.
Shopify Sales Analytics Dashboard
This dashboard pattern is useful for monitoring performance, spotting exceptions, and giving managers a shared KPI view. Typical KPIs may include volume, value, rate, trend, target variance, backlog, conversion, or quality measures depending on the data source.
Student Performance Dashboard
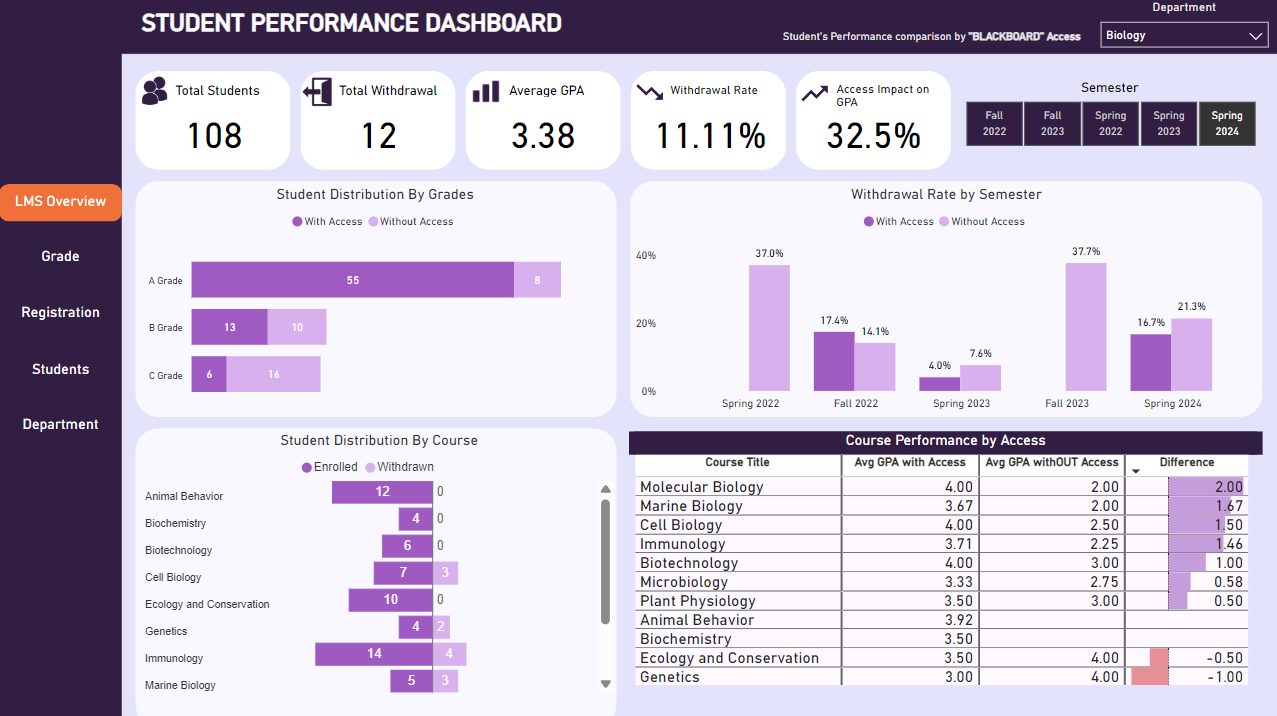
This dashboard pattern is useful for monitoring performance, spotting exceptions, and giving managers a shared KPI view. Typical KPIs may include volume, value, rate, trend, target variance, backlog, conversion, or quality measures depending on the data source.
Law Firm Dashboard
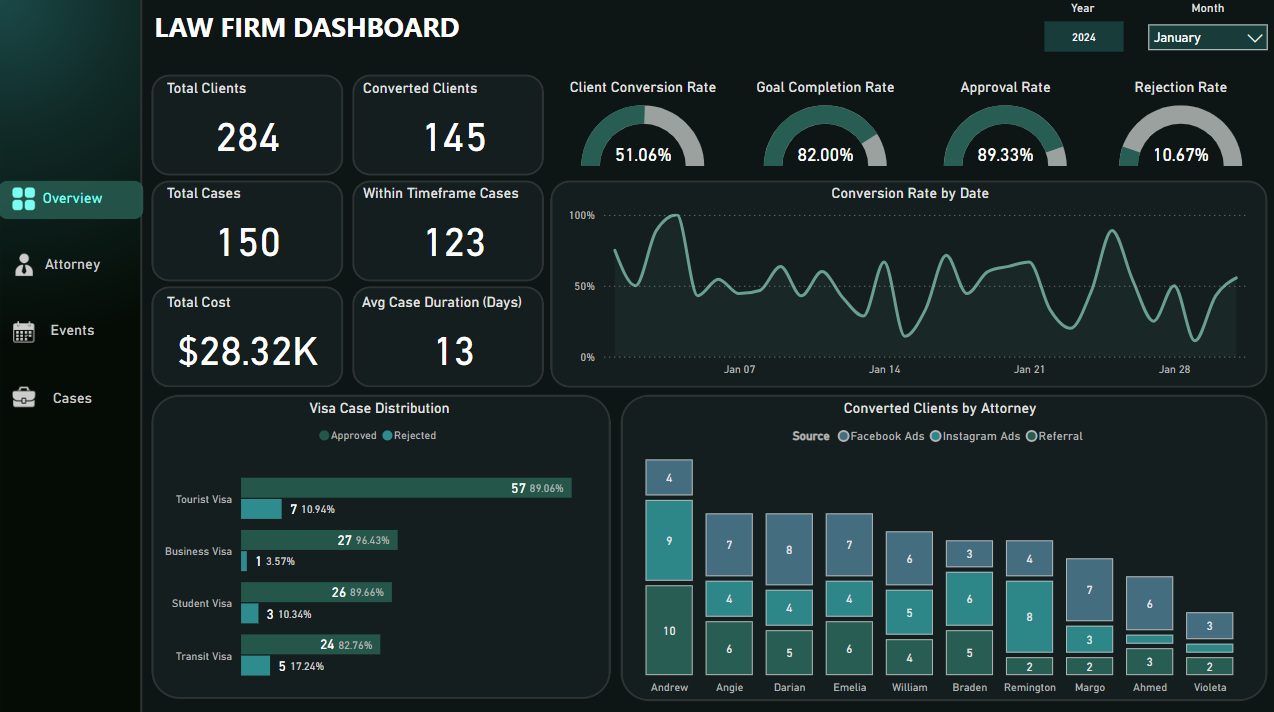
This dashboard pattern is useful for monitoring performance, spotting exceptions, and giving managers a shared KPI view. Typical KPIs may include volume, value, rate, trend, target variance, backlog, conversion, or quality measures depending on the data source.
Production Dashboard – Modern Layout
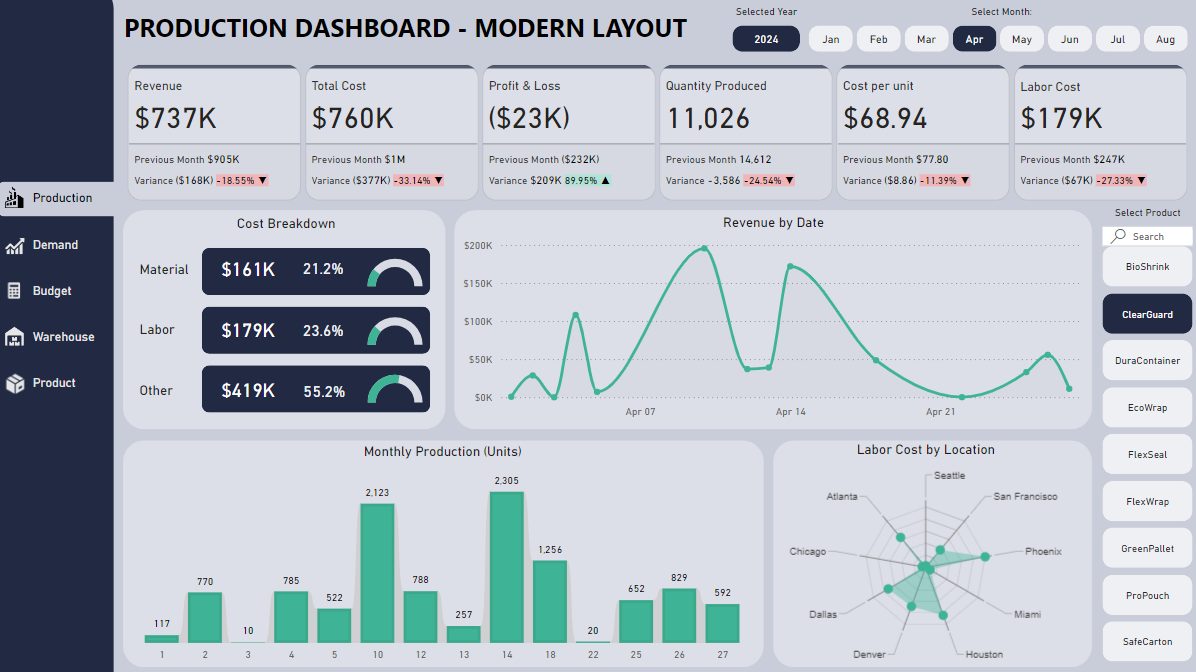
This dashboard pattern is useful for monitoring performance, spotting exceptions, and giving managers a shared KPI view. Typical KPIs may include volume, value, rate, trend, target variance, backlog, conversion, or quality measures depending on the data source.
Advertisement & Marketing Campaign Analysis
This dashboard pattern is useful for monitoring performance, spotting exceptions, and giving managers a shared KPI view. Typical KPIs may include volume, value, rate, trend, target variance, backlog, conversion, or quality measures depending on the data source.
Youtube Video Dashboard
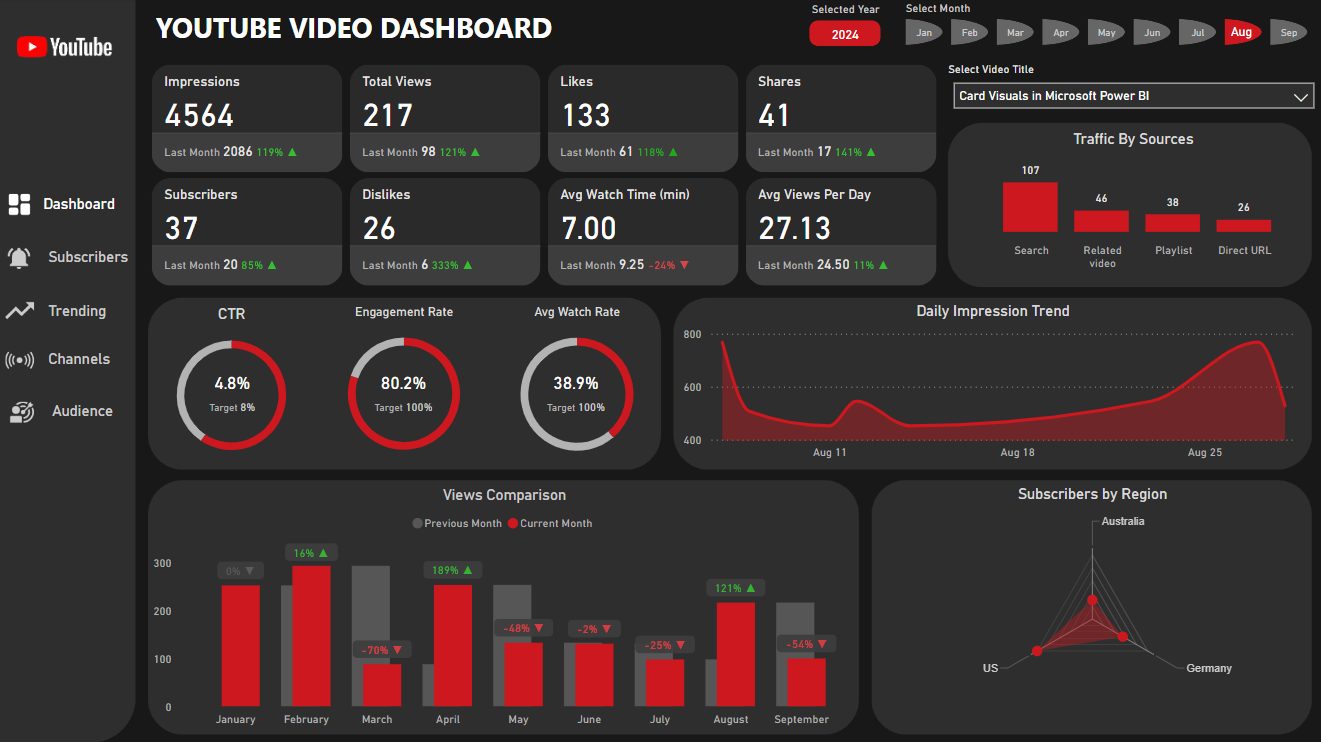
This dashboard pattern is useful for monitoring performance, spotting exceptions, and giving managers a shared KPI view. Typical KPIs may include volume, value, rate, trend, target variance, backlog, conversion, or quality measures depending on the data source.
Vehicle Fleet Management Dashboard
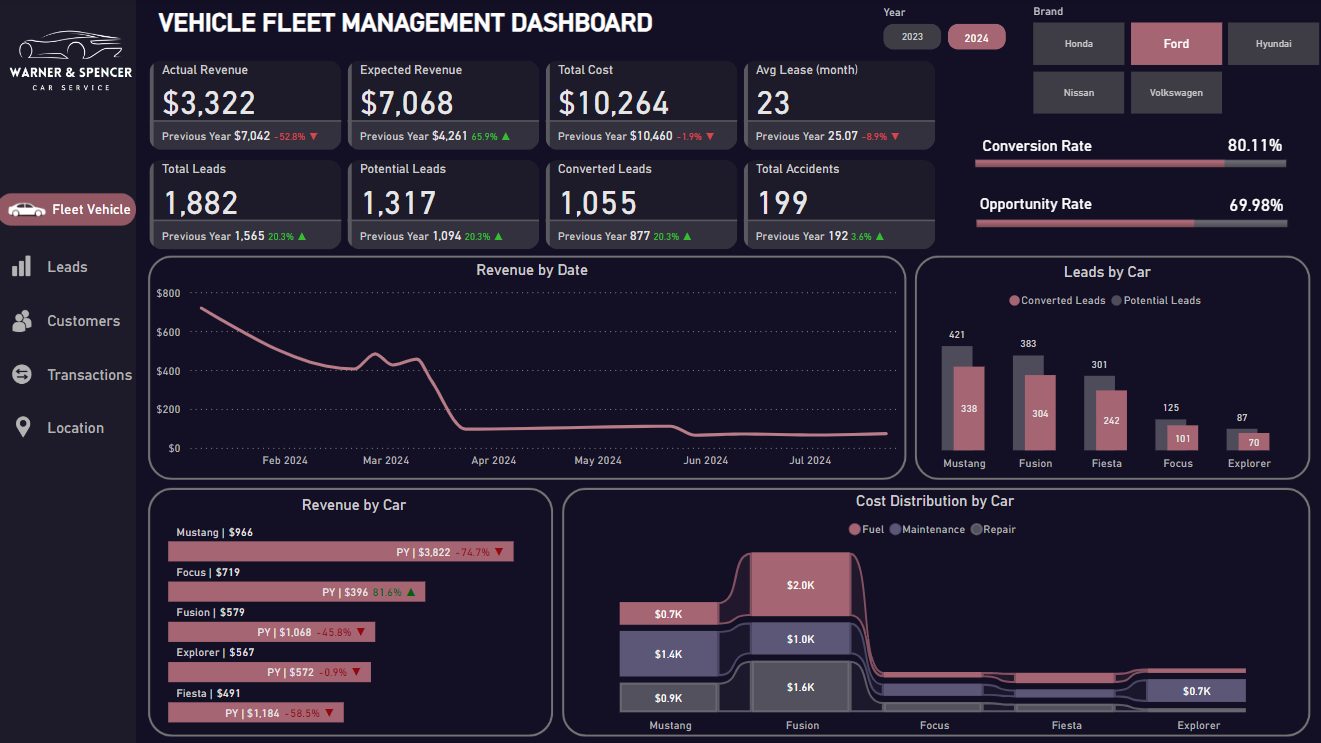
This dashboard pattern is useful for monitoring performance, spotting exceptions, and giving managers a shared KPI view. Typical KPIs may include volume, value, rate, trend, target variance, backlog, conversion, or quality measures depending on the data source.
Medical Billing Dashboard
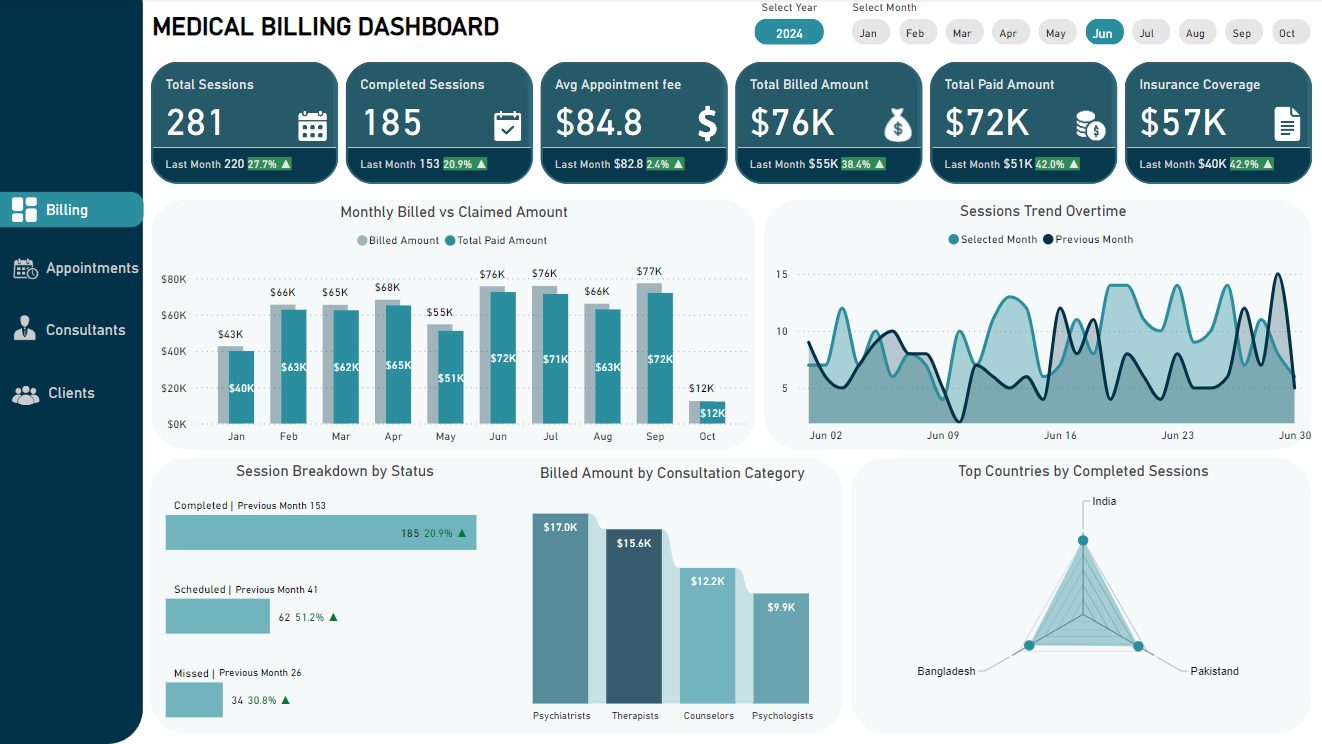
This dashboard pattern is useful for monitoring performance, spotting exceptions, and giving managers a shared KPI view. Typical KPIs may include volume, value, rate, trend, target variance, backlog, conversion, or quality measures depending on the data source.
Parking Revenue Dashboard
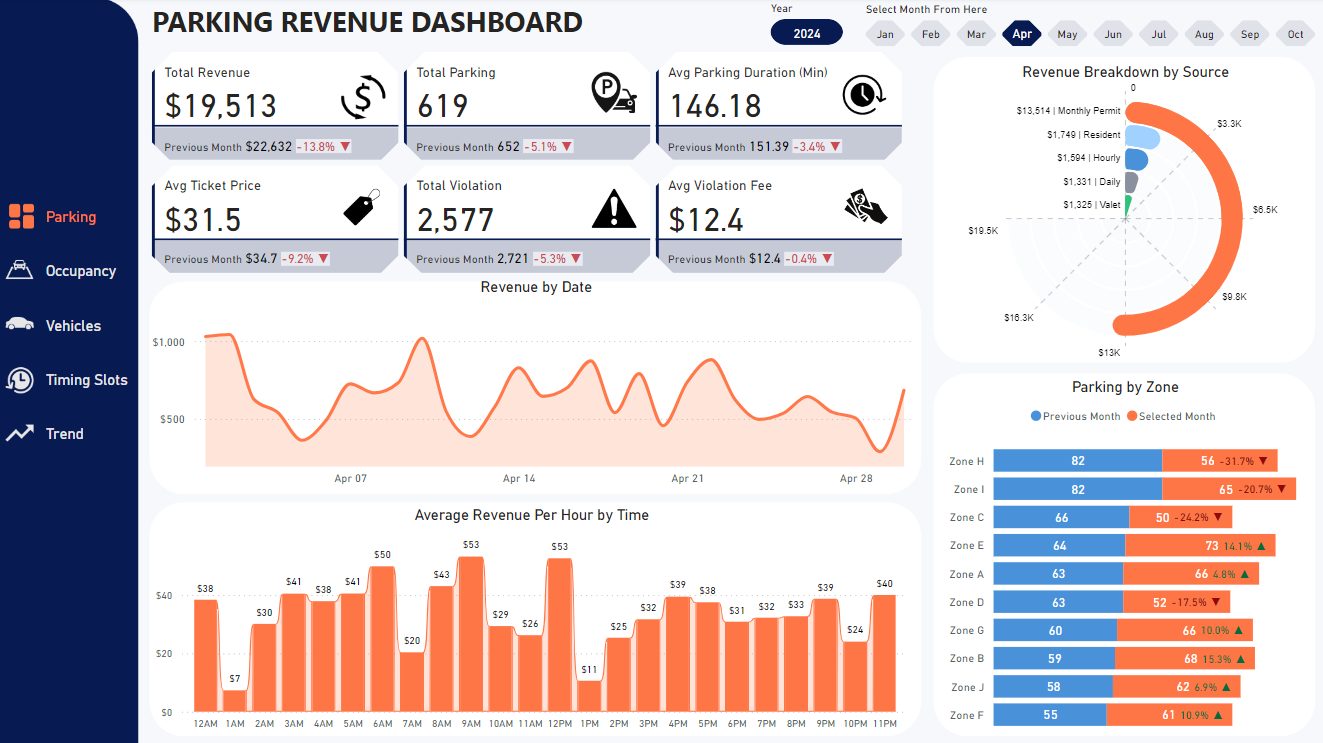
This dashboard pattern is useful for monitoring performance, spotting exceptions, and giving managers a shared KPI view. Typical KPIs may include volume, value, rate, trend, target variance, backlog, conversion, or quality measures depending on the data source.
Delivery Tracking Dashboard
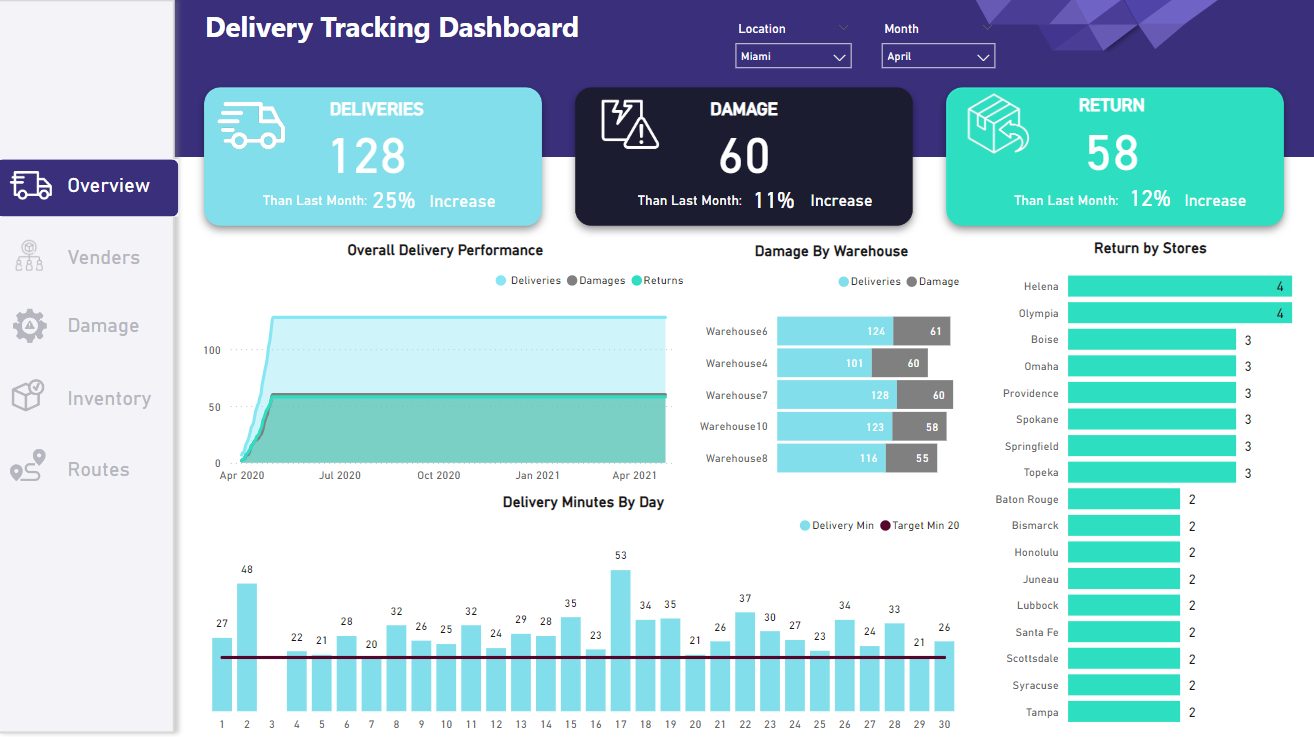
This dashboard pattern is useful for monitoring performance, spotting exceptions, and giving managers a shared KPI view. Typical KPIs may include volume, value, rate, trend, target variance, backlog, conversion, or quality measures depending on the data source.
Facebook Ads Dashboard
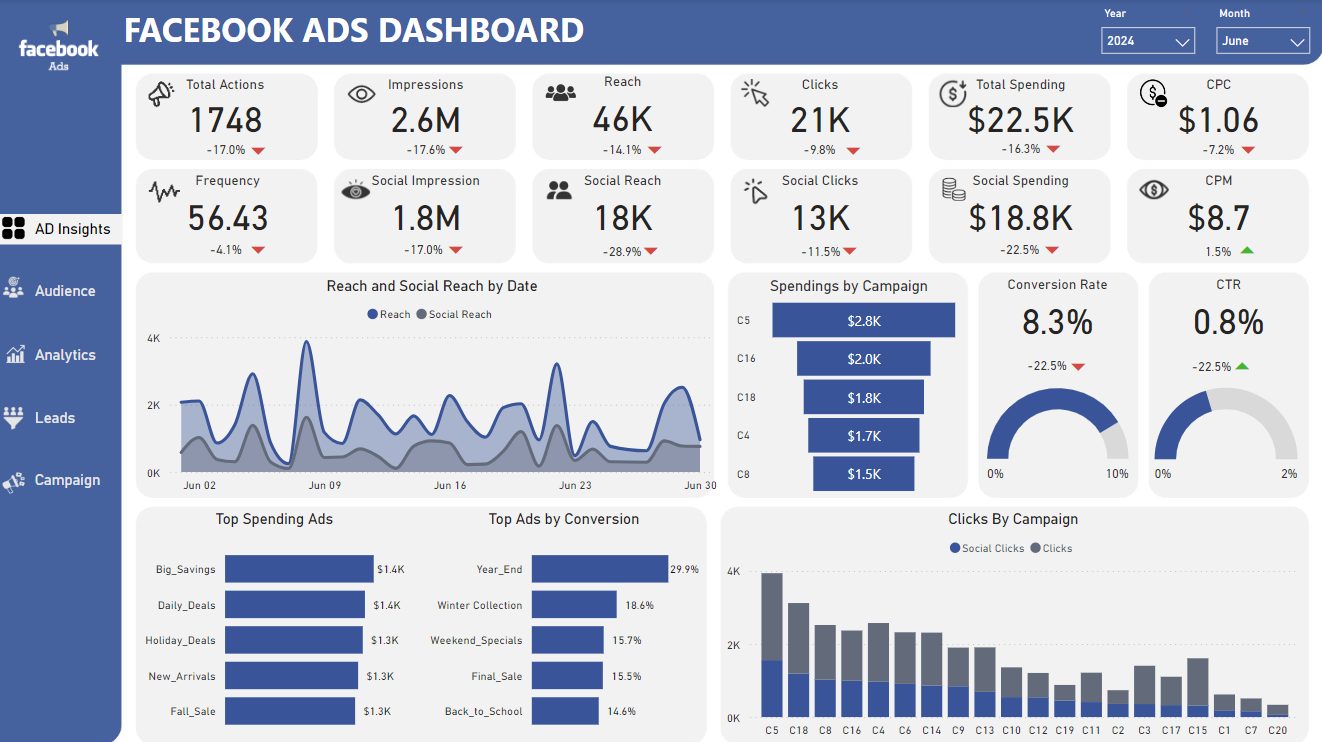
This dashboard pattern is useful for monitoring performance, spotting exceptions, and giving managers a shared KPI view. Typical KPIs may include volume, value, rate, trend, target variance, backlog, conversion, or quality measures depending on the data source.
Ecommerce Sales Dashboard
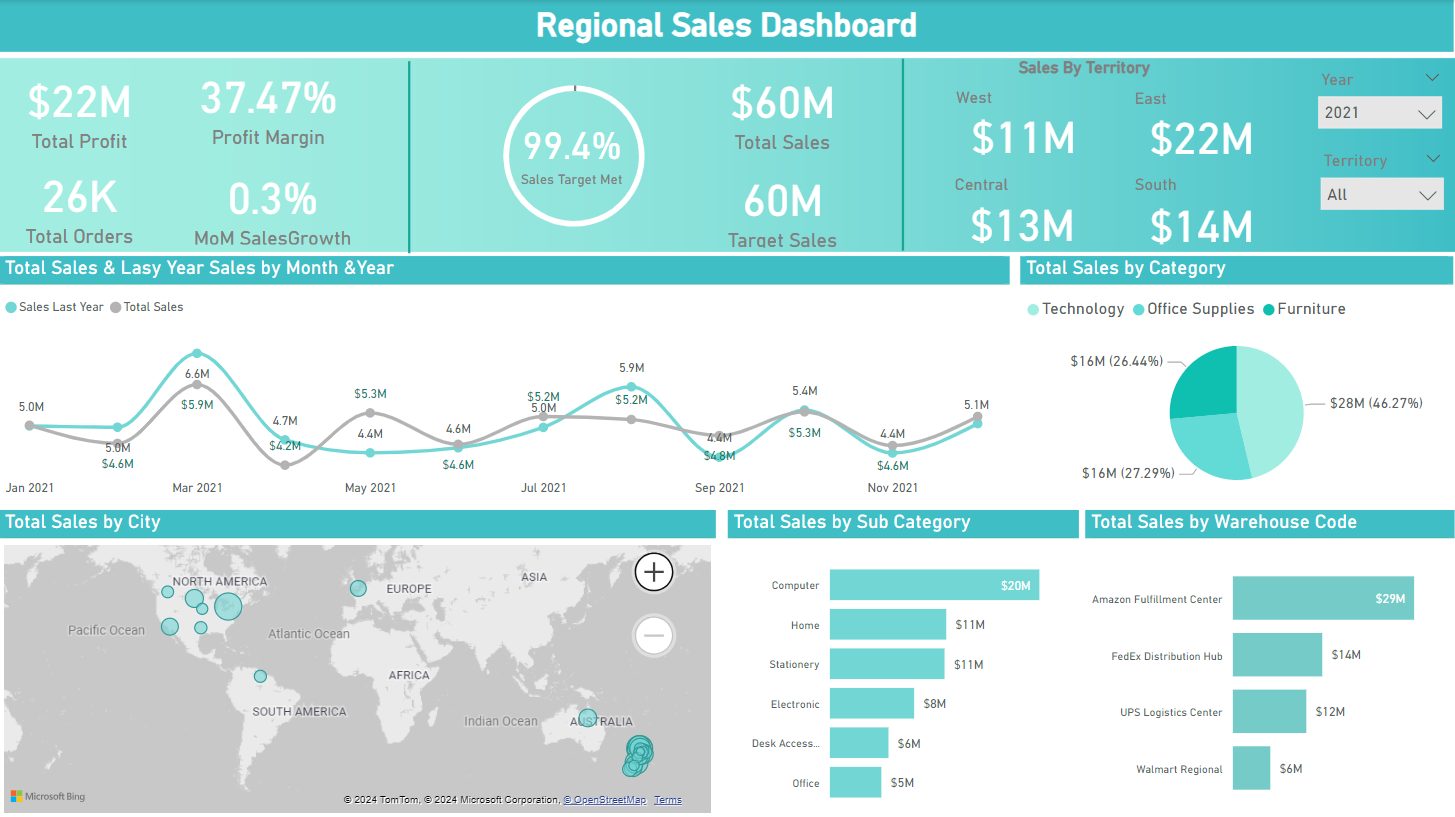
This dashboard pattern is useful for monitoring performance, spotting exceptions, and giving managers a shared KPI view. Typical KPIs may include volume, value, rate, trend, target variance, backlog, conversion, or quality measures depending on the data source.
OEE Dashboard
This dashboard pattern is useful for monitoring performance, spotting exceptions, and giving managers a shared KPI view. Typical KPIs may include volume, value, rate, trend, target variance, backlog, conversion, or quality measures depending on the data source.
Inventory Management Dashboard
This dashboard pattern is useful for monitoring performance, spotting exceptions, and giving managers a shared KPI view. Typical KPIs may include volume, value, rate, trend, target variance, backlog, conversion, or quality measures depending on the data source.
Recruitment Analytics Dashboard
This dashboard pattern is useful for monitoring performance, spotting exceptions, and giving managers a shared KPI view. Typical KPIs may include volume, value, rate, trend, target variance, backlog, conversion, or quality measures depending on the data source.
Want one of these examples adapted for your business?
MSI Analytics can turn your Excel, CRM, finance, sales, marketing, or operations data into a custom Power BI KPI dashboard. Contact MSI Analytics to discuss your dashboard.
Sources and further reading: Microsoft Power BI KPI visual documentation; Microsoft Power BI dashboard basics; Microsoft Power BI dashboard tiles; Microsoft Power BI card visual documentation.