
HR analytics guide
Power BI HR dashboards for better workforce reporting
Use Power BI to track headcount, hiring, attrition, payroll cost, DEI, learning, and engagement without forcing HR teams back into spreadsheet reporting.
Power BI HR dashboards should show what is changing in the workforce, where risk is building, and which action an HR or leadership team should take next. A useful dashboard goes beyond attractive visuals. It needs trusted employee definitions, clean date logic, secure access, and pages built around real HR decisions.
The best starting point is usually a workforce overview with drill paths into recruitment, attrition, absence, payroll cost, diversity, performance, and learning. That gives HR one shared reporting model instead of separate exports from an HRIS, payroll system, applicant tracking system, and survey tool.
What Power BI HR dashboards should show
A Power BI HR dashboard should help managers answer practical workforce questions: how many people we have, where hiring is delayed, why people leave, where absence is rising, how payroll cost is moving, and whether people decisions are fair and consistent.
Show current headcount, new starters, leavers, net change, vacancy count, and planned roles.
Track time to fill, funnel conversion, offer acceptance, turnover, regretted leavers, and early attrition.
Document metric rules and restrict sensitive employee detail to the people who should see it.
That structure answers the real need behind power bi hr dashboards better than a pure gallery. Readers want examples, but they also need to know which metrics belong on each page and how to avoid a dashboard that HR cannot trust.
Power BI HR dashboard examples
The examples below are practical page patterns for HR teams. Use them as a starting point, then adapt the KPIs and drill paths to your own HR systems, manager permissions, and reporting cadence. If you want a broader cross-functional benchmark first, these Power BI KPI dashboard examples show how MSI structures shared reporting pages across other business areas.
Workforce overview dashboard
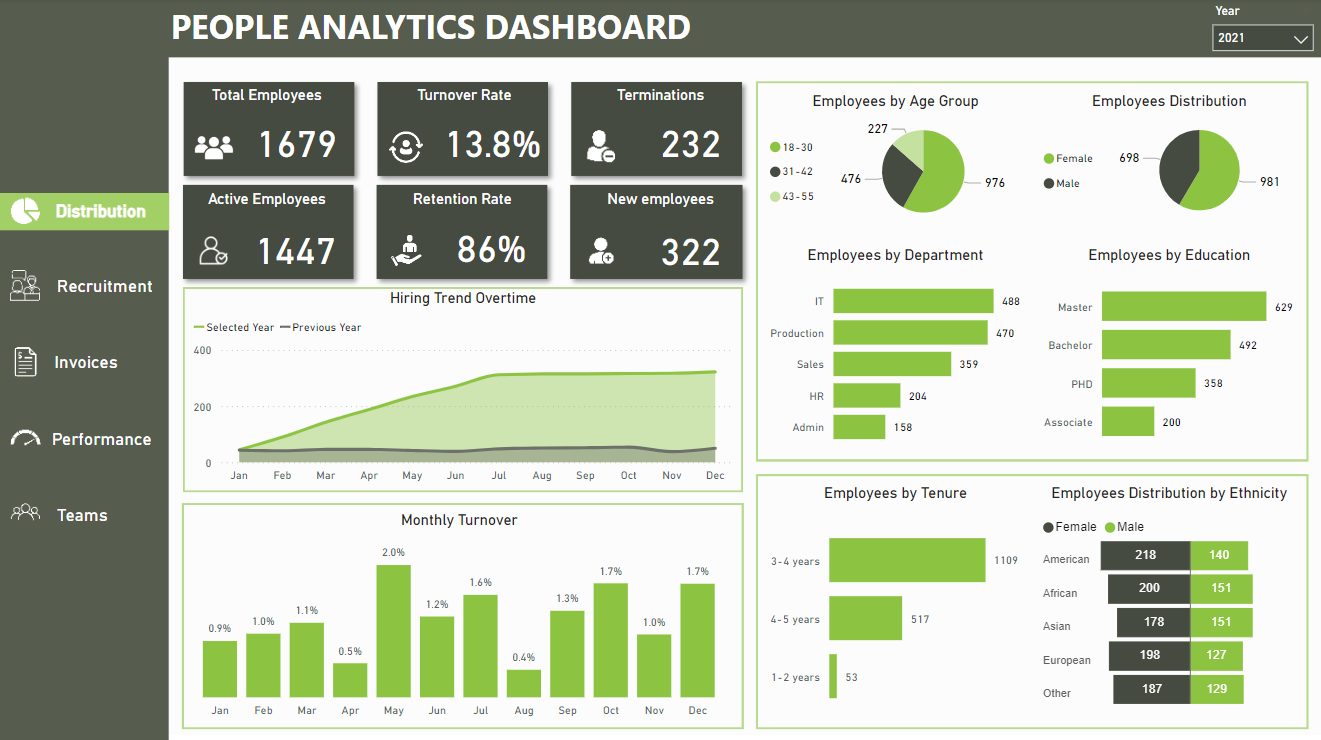
The workforce overview is the leadership page. It should show current headcount, active employees, new starters, leavers, vacancies, internal moves, tenure, and department mix. A good version lets a director move from company-wide totals to department, location, role family, contract type, and manager.
Recruitment dashboard
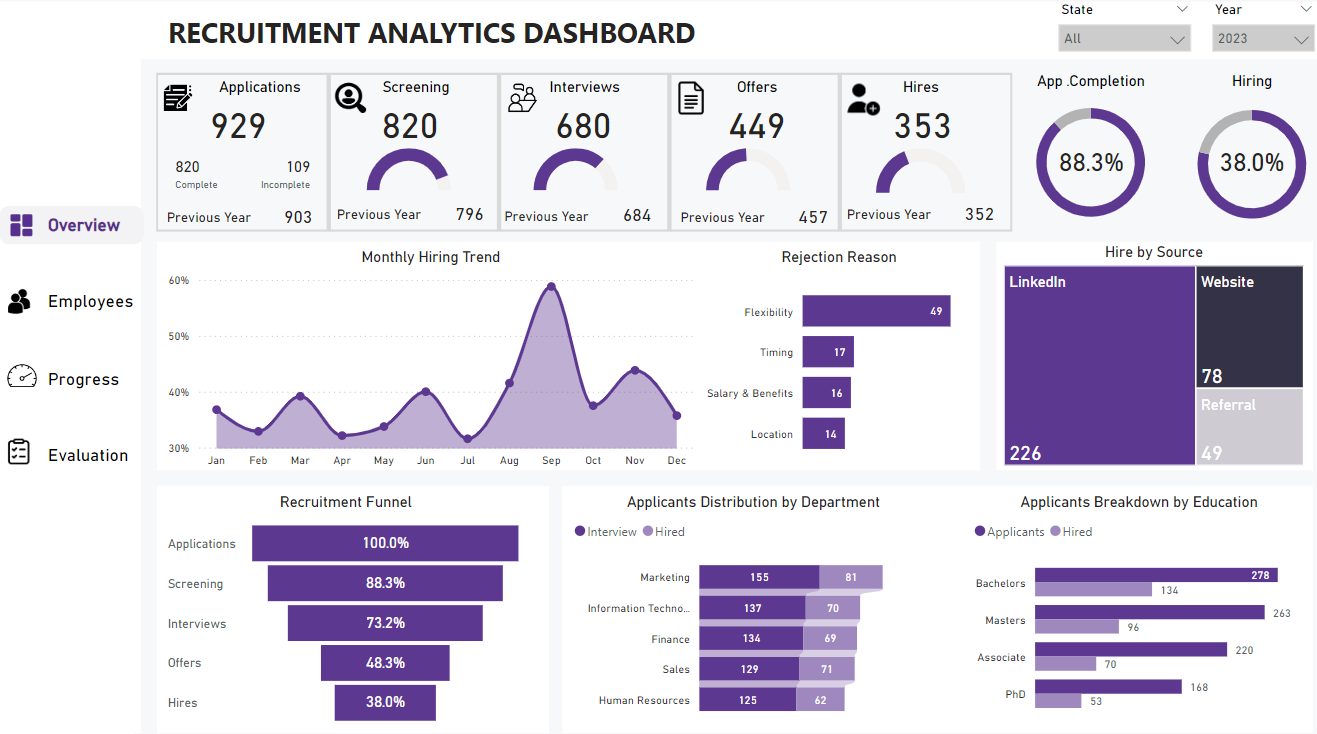
A recruitment dashboard should show the hiring pipeline, open vacancies, applications, interviews, offers, accepted offers, time to fill, cost per hire, and source performance. The important view is not only “how many candidates”. It is where hiring is stuck and which roles are creating business risk.
Attrition and retention dashboard
An attrition dashboard should separate voluntary and involuntary leavers, regretted leavers, early-tenure exits, resignation reasons, department patterns, and manager-level signals. It should also show the denominator behind each rate, because small teams can produce misleading percentages.
Payroll and workforce cost dashboard
A payroll dashboard should connect salary, overtime, allowances, bonus, employer taxes, benefits, agency spend, and cost allocation. Finance and HR often need the same dashboard here, but they may define cost centres, active employees, and reporting periods differently. Resolve those definitions before designing visuals. The overlap is usually easiest to see in financial dashboards in Power BI, where the same cost and period definitions often drive executive reporting as well.
DEI and engagement dashboard
DEI and engagement reporting needs extra care. Aggregate sensitive attributes, suppress small groups where needed, and avoid ranking individuals. The dashboard should support fair decision-making by showing representation, progression, pay bands, engagement scores, response rates, and promotion movement at a safe level of detail.
Learning and performance dashboard
Learning dashboards connect course completion, mandatory training, role readiness, assessment scores, certification expiry, and manager follow-up. Performance pages can show review completion, objective status, rating distribution, and development actions, but they should not become a public leaderboard of employees.
HR KPIs to include
Choose KPIs by decision area. A senior leader may need headcount trend and payroll cost. A recruiter needs open roles and time to fill. An HR business partner may need attrition by department, absence trends, engagement movement, and manager-level drill paths.
| Dashboard page | Useful KPIs | Best drill path | Decision it supports |
|---|---|---|---|
| Workforce overview | Headcount, active employees, starters, leavers, net change, vacancies | Department to location to role family | Capacity planning and leadership reporting |
| Recruitment | Open roles, applicants, interviews, offers, time to fill, source conversion | Role to hiring stage to source | Recruitment focus and channel investment |
| Attrition | Turnover rate, voluntary leavers, regretted leavers, early exits, resignation reason | Business unit to manager to tenure band | Retention action and workforce risk review |
| Payroll cost | Salary, overtime, allowances, benefits, agency cost, cost per employee | Cost centre to role to period | Budget control and workforce cost planning |
| Absence | Absence days, absence rate, recurring absence, reason, lost time | Department to team to absence type | Wellbeing, coverage, and operational planning |
| DEI | Representation, hiring mix, promotion mix, pay band distribution, survey response | Level to department to safe demographic group | Fairness review and policy follow-up |
| Learning | Completion rate, overdue training, certification expiry, assessment score | Role to course to employee group | Compliance and skills planning |
How to model HR data in Power BI
HR dashboards become unreliable when every report is built from a different export. Microsoft guidance recommends star schema design for Power BI models because it gives measures a clearer structure and makes filtering more predictable. For HR, that usually means shared employee, date, department, role, location, and manager dimensions connected to fact tables such as payroll, recruitment events, absence, learning, and survey responses.
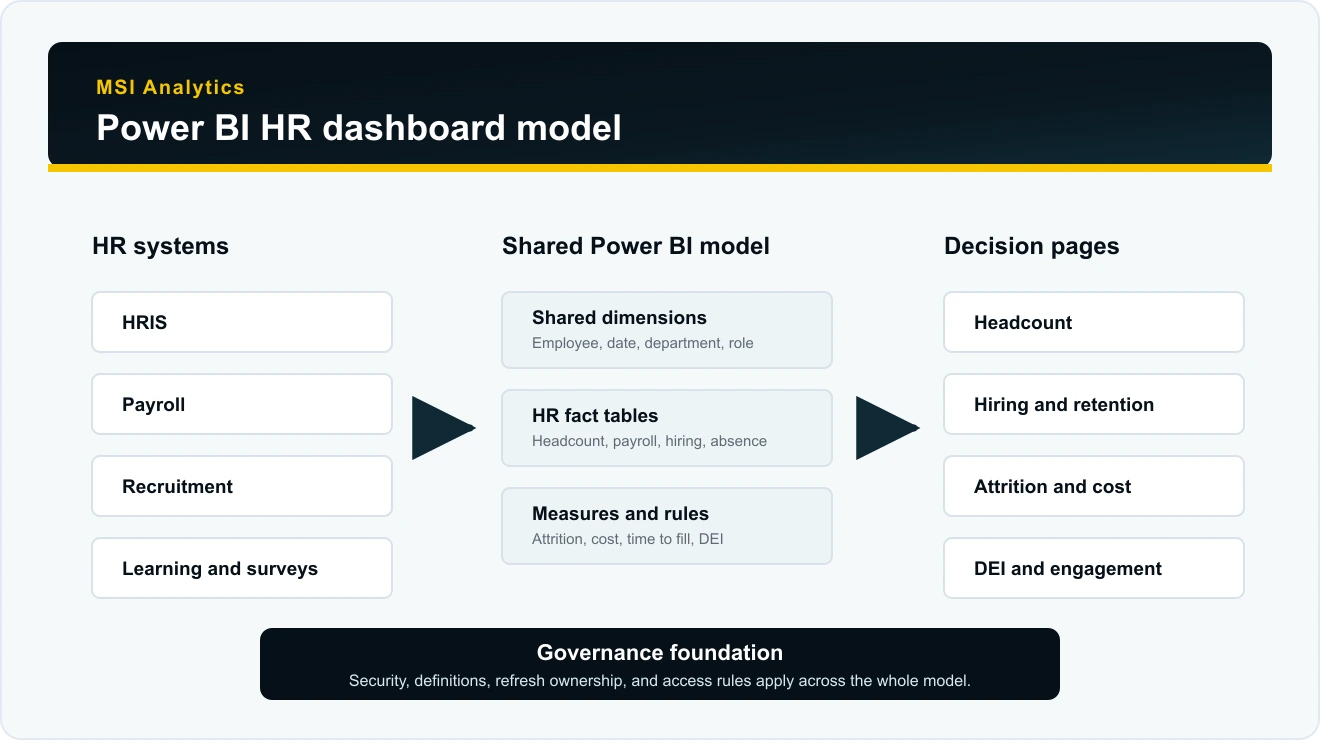
Many HR teams also need slowly changing attributes. If an employee moved department in March, last year’s attrition analysis should not always show that person under the latest department. Decide whether each page uses current structure, historical structure, or both.
Security and privacy rules
HR data is sensitive, so security belongs in the design from the start. Microsoft describes row-level security as a way to restrict data access for users of a Power BI semantic model. For HR, that can mean managers see only their own teams, executives see aggregated views, and HR administrators see approved detail pages.
- Keep employee-level pages separate from leadership summary pages.
- Use security groups rather than manual one-off permissions where possible.
- Suppress or aggregate small demographic groups on DEI pages.
- Document who owns each metric and who can approve access changes.
- Review refresh failures and expired credentials before leadership meetings.
Template or custom dashboard
A Power BI HR dashboard template can help with layout ideas and early stakeholder conversations. It is rarely enough for production reporting unless your HR data model, definitions, security rules, and source systems match the template closely.
| Option | Best fit | Risk | What to check |
|---|---|---|---|
| Template | Early planning, layout ideas, proof of concept | Metrics may not match HR definitions | Can you map every field and formula safely? |
| Custom dashboard | Leadership reporting, sensitive HR data, multiple sources | Needs more discovery and validation | Are owners, rules, access, and refresh agreed? |
| Hybrid | Teams that want a faster start with controlled customisation | Can inherit weak template assumptions | Which parts are design inspiration only? |
How to build the dashboard
- Define the audience. Separate executive, HR business partner, recruiter, finance, and manager views.
- Agree the metric dictionary. Write the definition, source, grain, owner, and refresh rule for each KPI.
- Prepare the model. Build shared dimensions and fact tables instead of one flat spreadsheet.
- Design pages around decisions. Put summary, trend, variance, and drill-through detail in predictable places.
- Apply security. Test row-level security and hide sensitive fields that summary users do not need.
- Validate totals. Reconcile headcount, payroll, vacancies, and leavers against trusted HR and finance reports.
- Publish and govern. Set refresh schedules, monitor failures, and document ownership for changes.
Common mistakes
Building from screenshots instead of decisions
Example galleries and templates can help with design, but they cannot tell you which HR decisions matter in your organisation. Start with decisions, not visuals.
Mixing employee snapshots with events
Headcount snapshots, payroll transactions, recruitment stages, and absence events have different grains. Mixing them without a clear model creates confusing totals.
Ignoring historical department changes
If teams reorganise often, “current department” and “department at the time” may answer different questions. Choose deliberately.
Publishing sensitive detail too widely
HR dashboards should make workforce patterns visible without exposing personal data to users who do not need it.
Need an HR dashboard built around your data?
MSI Analytics can help turn HRIS, payroll, recruitment, learning, and survey data into a Power BI dashboard your team can trust. Book a dashboard discussion and share the reporting problem you want to solve.
Frequently asked questions
What should a Power BI HR dashboard include?
Most HR dashboards should include headcount, starters, leavers, vacancies, recruitment progress, attrition, absence, payroll cost, and a small number of drill paths by department, role, location, manager, and period.
Is Power BI good for HR analytics?
Power BI is a good fit when HR data sits across multiple systems and leaders need repeatable reporting. It still needs clean definitions, a reliable model, and controlled access to sensitive data.
Can I use a Power BI HR dashboard template?
You can use a template for layout ideas or a proof of concept. For live reporting, check whether the template matches your source fields, metric definitions, security needs, and refresh requirements.
Which HR systems can feed Power BI?
Power BI can report from spreadsheets, databases, APIs, HRIS exports, payroll files, applicant tracking data, learning systems, and survey tools when the data can be accessed and modelled safely.
How often should an HR dashboard refresh?
Daily refresh is enough for many HR dashboards. Recruitment, absence, and operations-heavy teams may need more frequent refresh, while monthly board reporting may only need a controlled month-end refresh.
Sources: Microsoft Power BI star schema guidance; Microsoft Power BI data refresh guidance; Microsoft scheduled refresh documentation; Microsoft Fabric row-level security documentation; SHRM benchmarking HR metrics toolkit.