
Small business dashboard guide
Dashboard for Small Business Examples, KPIs, and Power BI Setup
A practical guide to the dashboards, KPIs, data sources, and Power BI setup decisions small business owners should think through before building reporting.
A dashboard for small business should show the numbers an owner checks before making decisions: sales, cash, leads, work in progress, customer activity, and operational exceptions. The best version is not the busiest screen. It is the one that makes the next action easier to see.
That is where many template pages stop short. They show a gallery of dashboards, but they do not explain which dashboard a small business should build first, which KPIs belong on it, or when a custom Power BI model is worth the effort. This guide covers those decisions using practical dashboard examples and MSI-owned Power BI visuals.
What is a small business dashboard?
A small business dashboard is a reporting view that brings the most important business metrics into one place. It may pull from spreadsheets, accounting software, CRM systems, ecommerce stores, ad platforms, project tools, or operational files.
For an owner, the value is not the chart itself. The value is being able to answer questions without chasing five exports: Are sales moving? Is cash tight? Which lead source is working? What work is delayed? Which customer, product, or location needs attention?
Microsoft describes Power BI as a business analytics platform for connecting, visualising, and sharing data across an organisation. For a small business, that usually means replacing manual reporting with a model that refreshes and keeps KPI definitions consistent.
Small business dashboard examples
The examples below focus on the decisions each dashboard supports, not only how the screen looks. Use them to compare the questions, KPIs, and data sources that matter for your business.
Owner dashboard
The owner dashboard should be the first page. It should avoid departmental detail and focus on weekly control: revenue, cash, leads, work in progress, overdue invoices, delayed orders, and the exceptions that need a decision.
| Question | Useful KPI | Typical source | Warning sign |
|---|---|---|---|
| Are we selling enough? | Revenue, sales growth, pipeline value | CRM, invoices, ecommerce store | Revenue flat while leads or quotes rise |
| Can we pay what is due? | Cash balance, receivables, payables | Accounting system, bank export | Receivables grow faster than cash collected |
| Where is work stuck? | Backlog, overdue jobs, cycle time | Project, operations, fulfilment files | More open work but no matching revenue movement |
| Which channel is worth funding? | Leads, conversion rate, cost per lead | CRM, Google Ads, Meta, GA4, HubSpot | Spend increases without qualified lead growth |
Sales dashboard
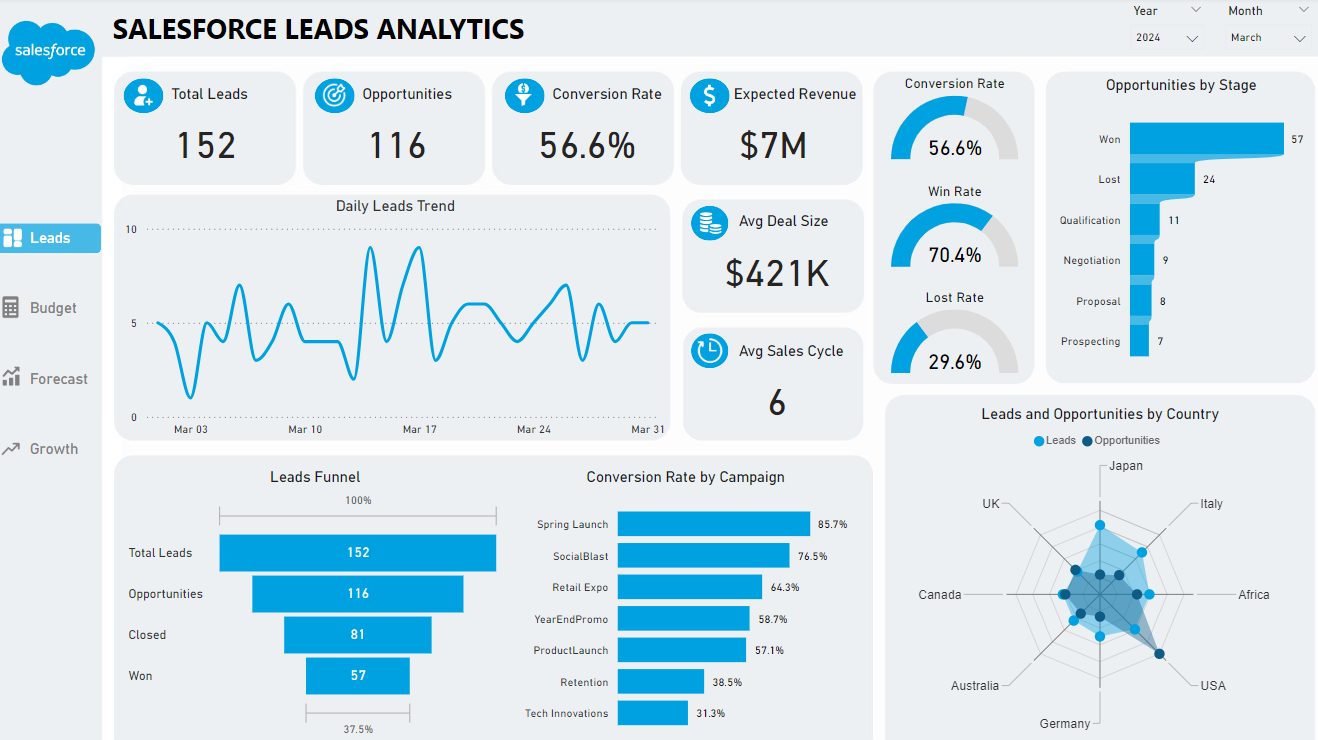
A sales dashboard for small business should show pipeline health, lead sources, conversion rate, sales by product or service, open opportunities, and follow-up activity. If the business uses HubSpot, Salesforce, Pipedrive, or spreadsheets, the dashboard should reconcile the pipeline to the same definitions every week.
If your sales data comes from a CRM, MSI’s guide to connecting HubSpot to Power BI explains the integration steps. The same modelling problems can affect a small firm: duplicate contacts, inconsistent lead-source names, missing owners, and unclear deal stages.
Financial dashboard
A financial dashboard should help the owner see cash, profit, spend, receivables, payables, and budget variance without waiting for a manually assembled report. For small businesses, cash flow is usually more urgent than a beautiful profit chart.
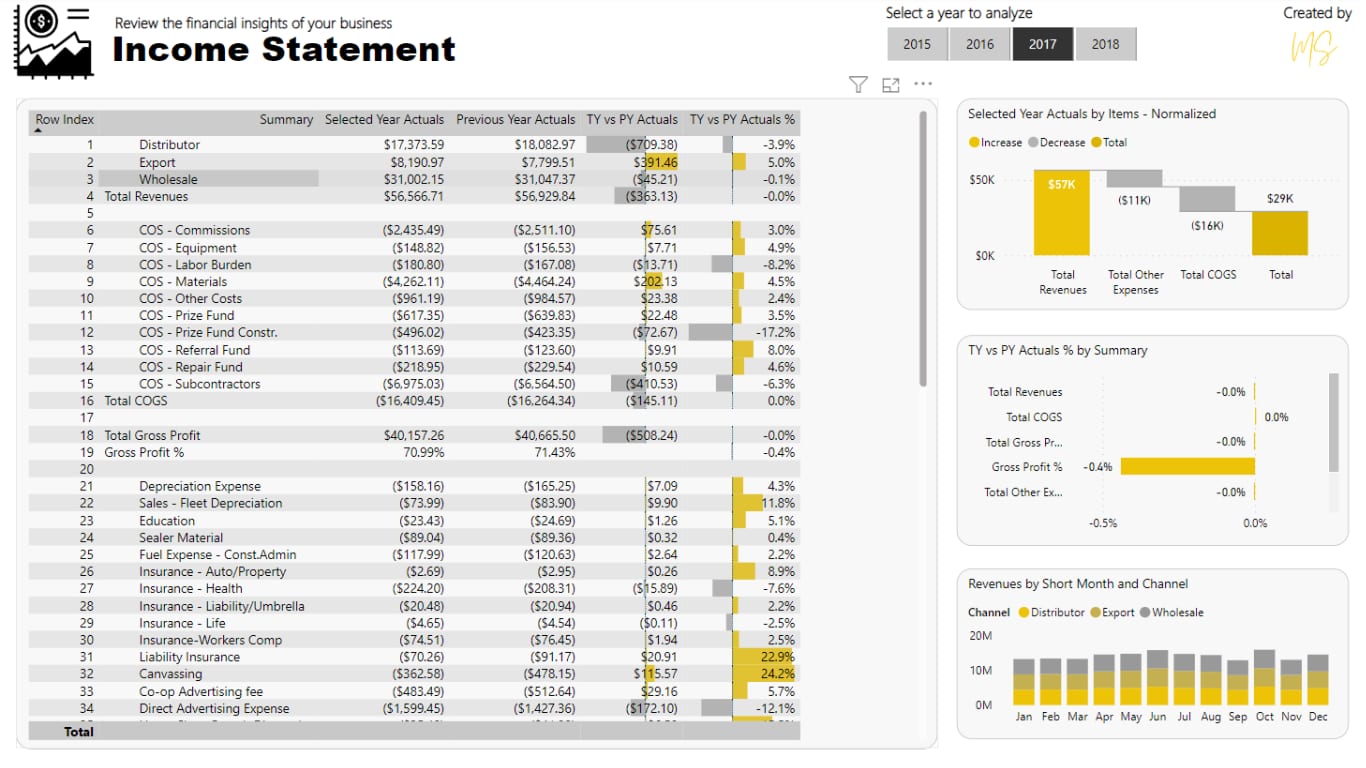
Good finance dashboards also need trust. Agree the sign convention, fiscal periods, account grouping, currency treatment, and scenario definitions before building the visual layer.
Marketing dashboard
A marketing dashboard should connect spend to useful outcomes. Page views and impressions may belong in the model, but the owner usually needs leads, qualified enquiries, campaign cost, conversion rate, and revenue influenced by each source.
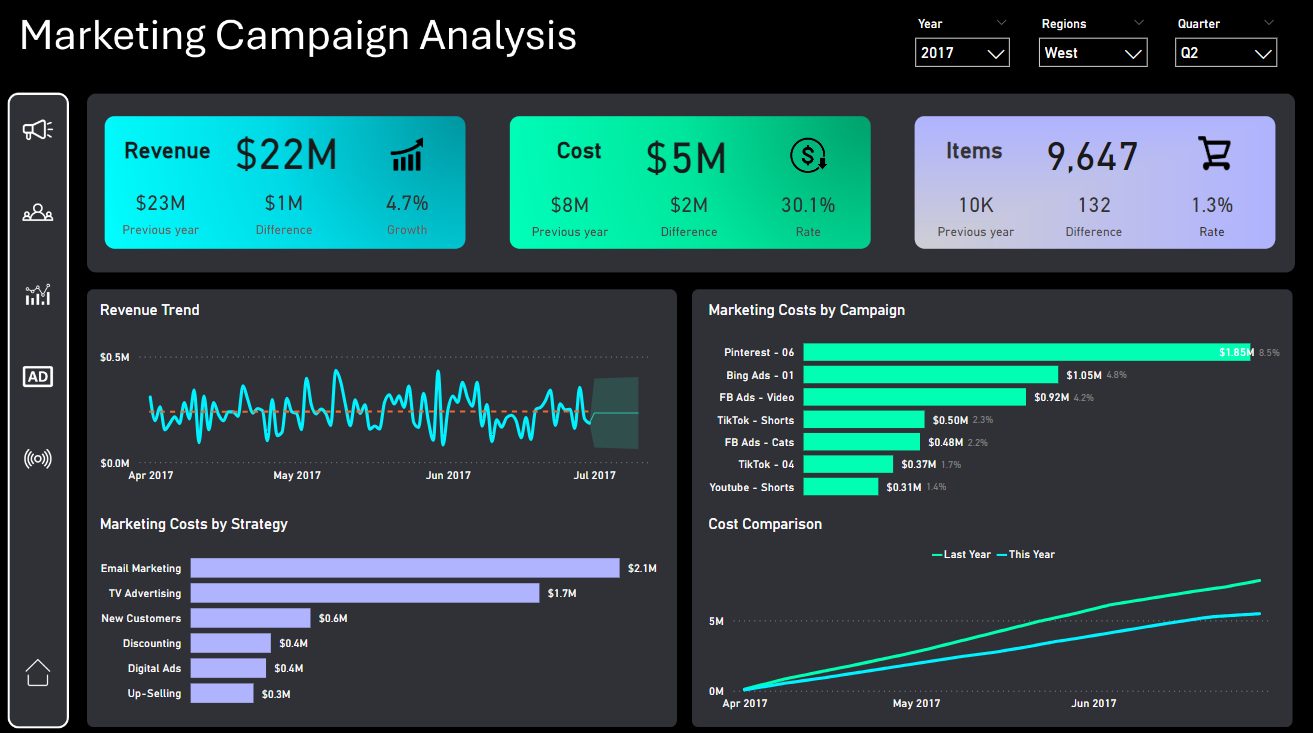
If HubSpot is the CRM, MSI already has a detailed guide on how to connect HubSpot to Power BI. That same approach can support small business lead and campaign reporting.
Operations dashboard
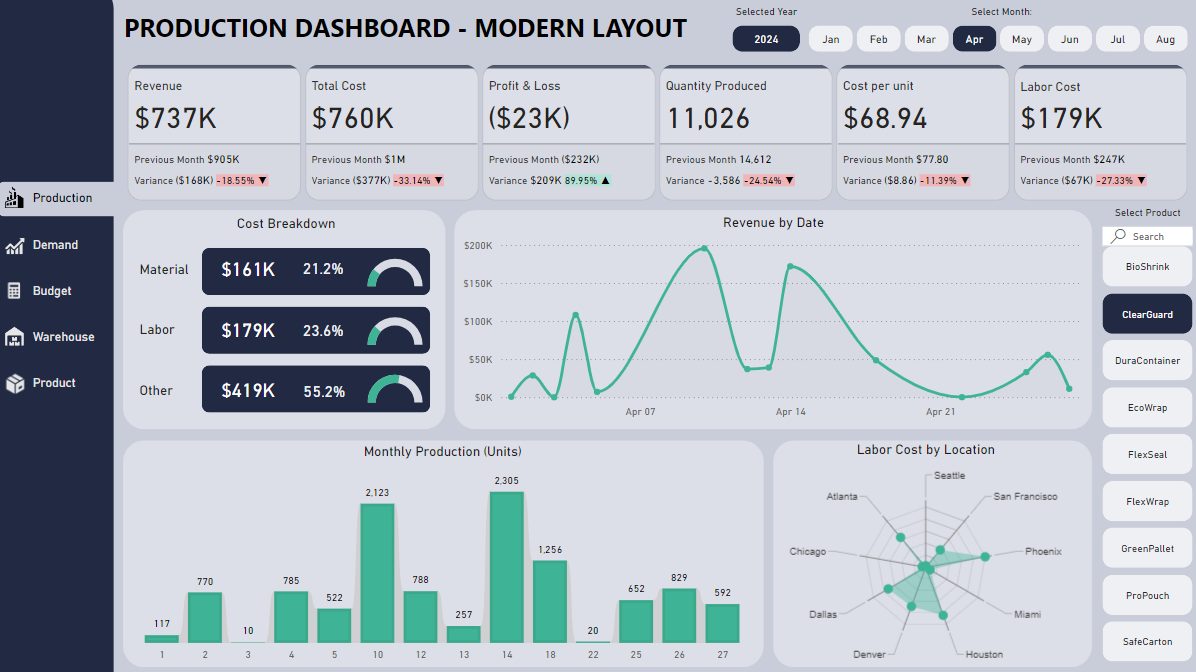
An operations dashboard should show whether the business can deliver what it has sold. Useful measures include order backlog, production output, fulfilment delays, inventory risk, utilisation, quality issues, and workload by team or location.
Ecommerce dashboard
For an online store, the dashboard should show sales, orders, average order value, conversion rate, returning customers, refund rate, stock movement, traffic source, and product performance. The real advantage comes when Shopify or WooCommerce data is joined with ad spend and finance data.
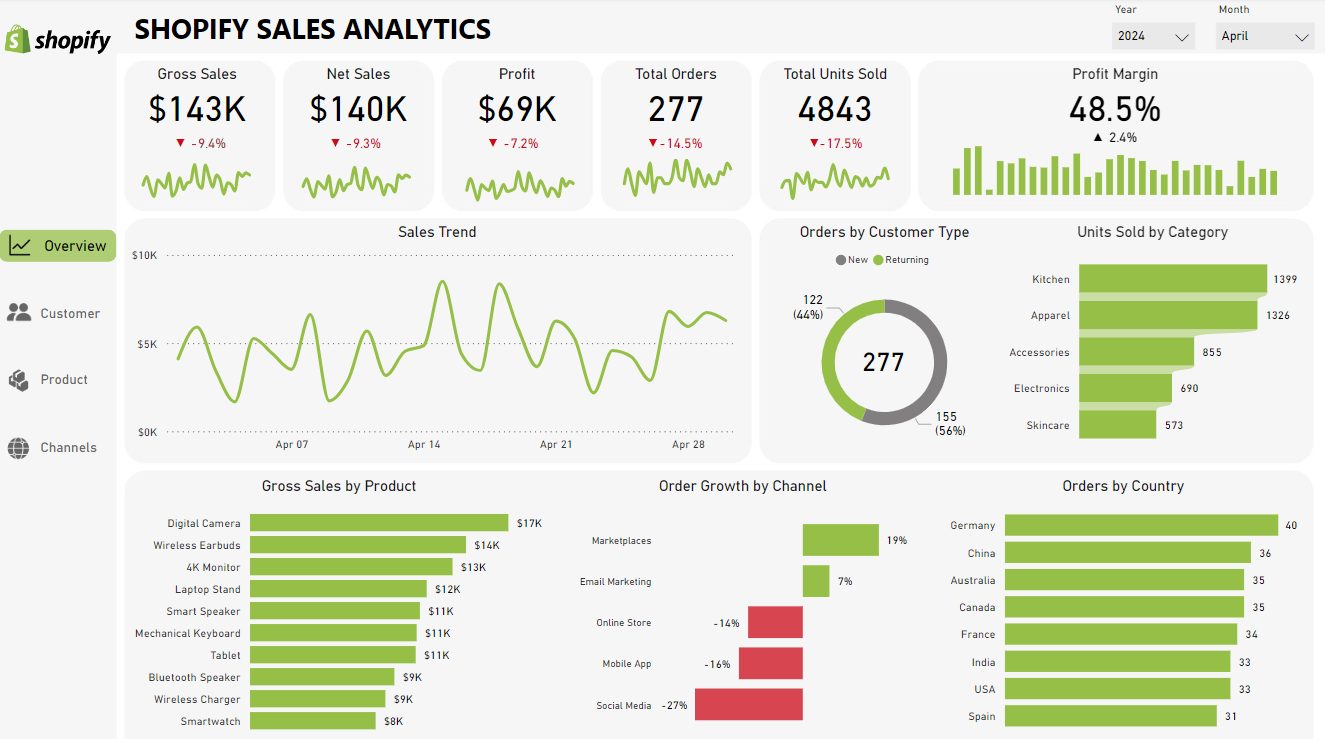
More small business dashboard examples
The examples above cover the main owner, sales, finance, marketing, operations, and ecommerce views. As a business grows, it may also need focused reporting for support, inventory, delivery, procurement, manufacturing, people, IT, website performance, or service work. The MSI-owned Power BI examples below show practical dashboard layouts for those needs.
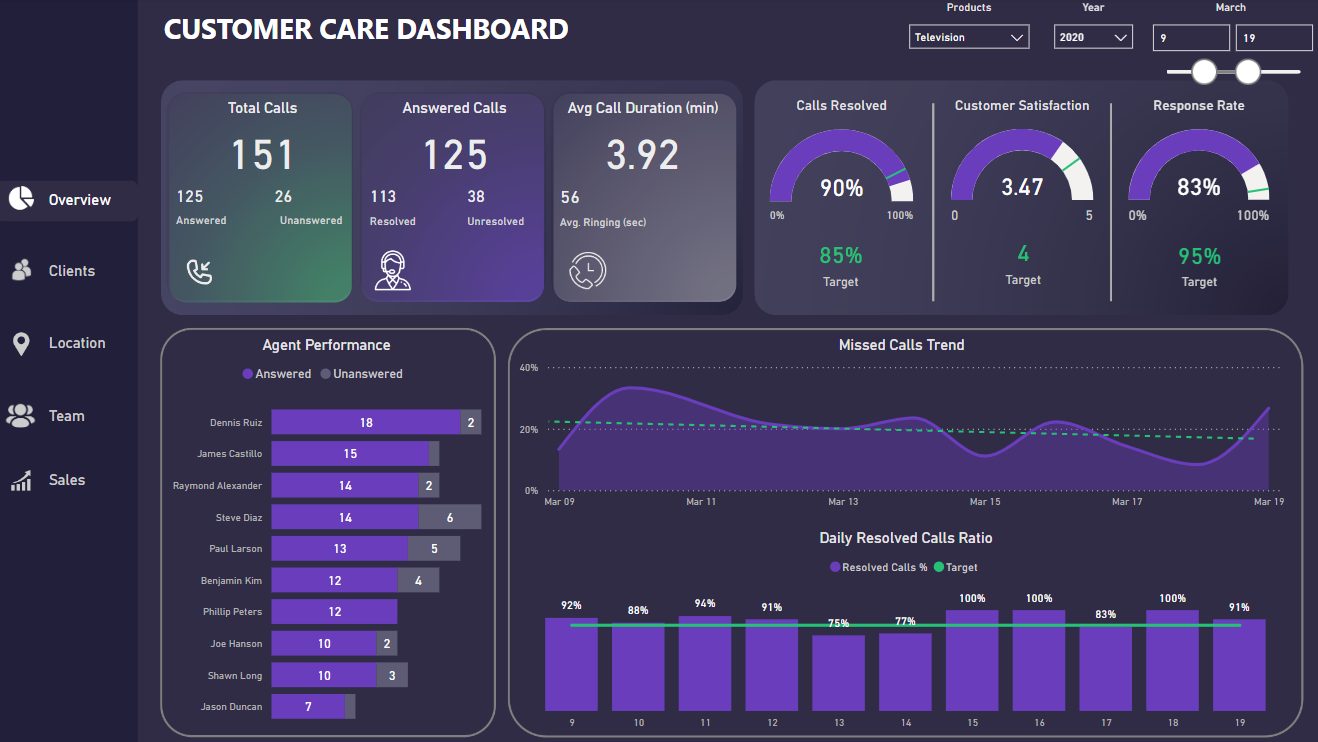
Customer support dashboard
Use this when service quality affects repeat orders, renewals, or referrals. It should show ticket volume, backlog, response time, resolution time, priority mix, and recurring complaint themes.
- Ticket volume
- Backlog
- Resolution time
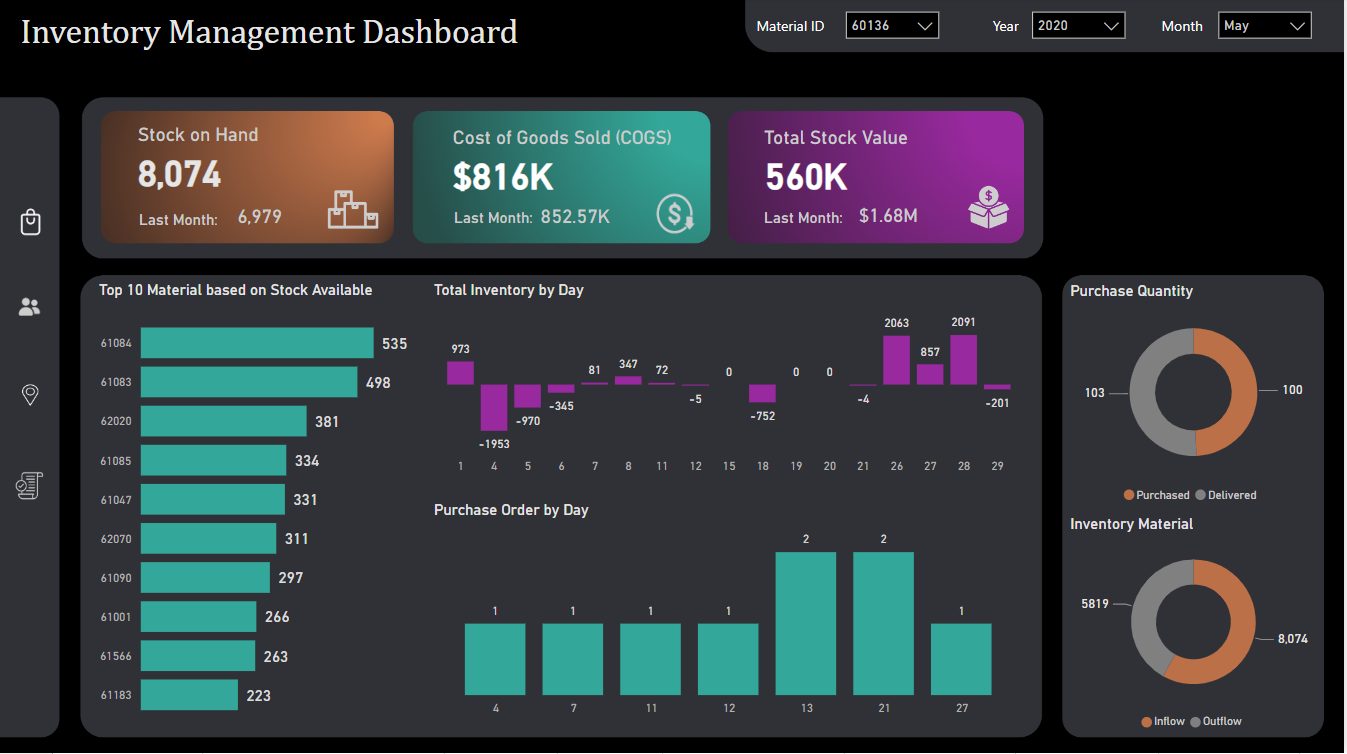
Inventory dashboard
Use this when stock levels, reorder timing, and slow-moving products affect cash and fulfilment. The page should make shortages and overstock visible before they turn into missed sales or trapped cash.
- Stock on hand
- Reorder risk
- Inventory days
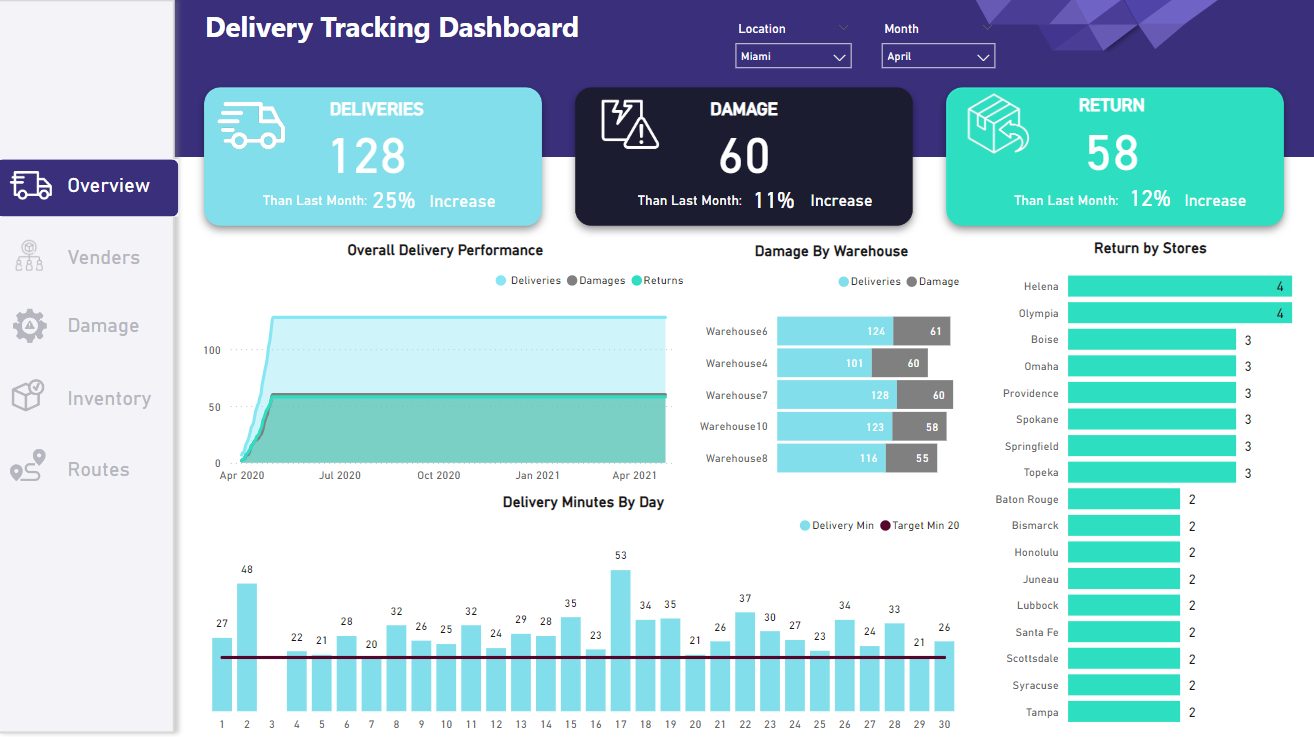
Delivery dashboard
Use this when customers care about on-time delivery. Track orders shipped, late deliveries, route or carrier performance, failed attempts, and fulfilment delays by region or product group.
- On-time rate
- Late orders
- Carrier performance
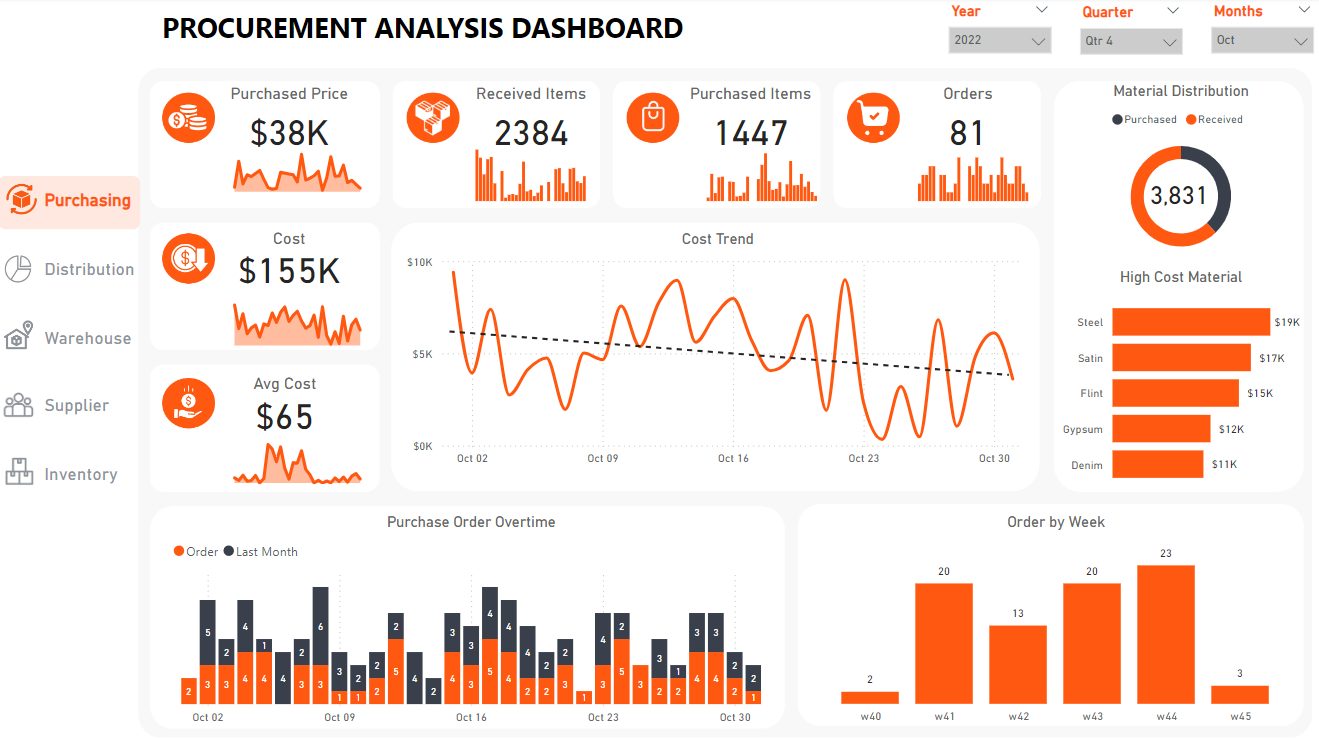
Procurement dashboard
Use this when supplier cost, order timing, and purchase volume affect margin. The dashboard should show spend by supplier, open purchase orders, late deliveries, price movement, and supplier concentration.
- Supplier spend
- Open POs
- Price variance
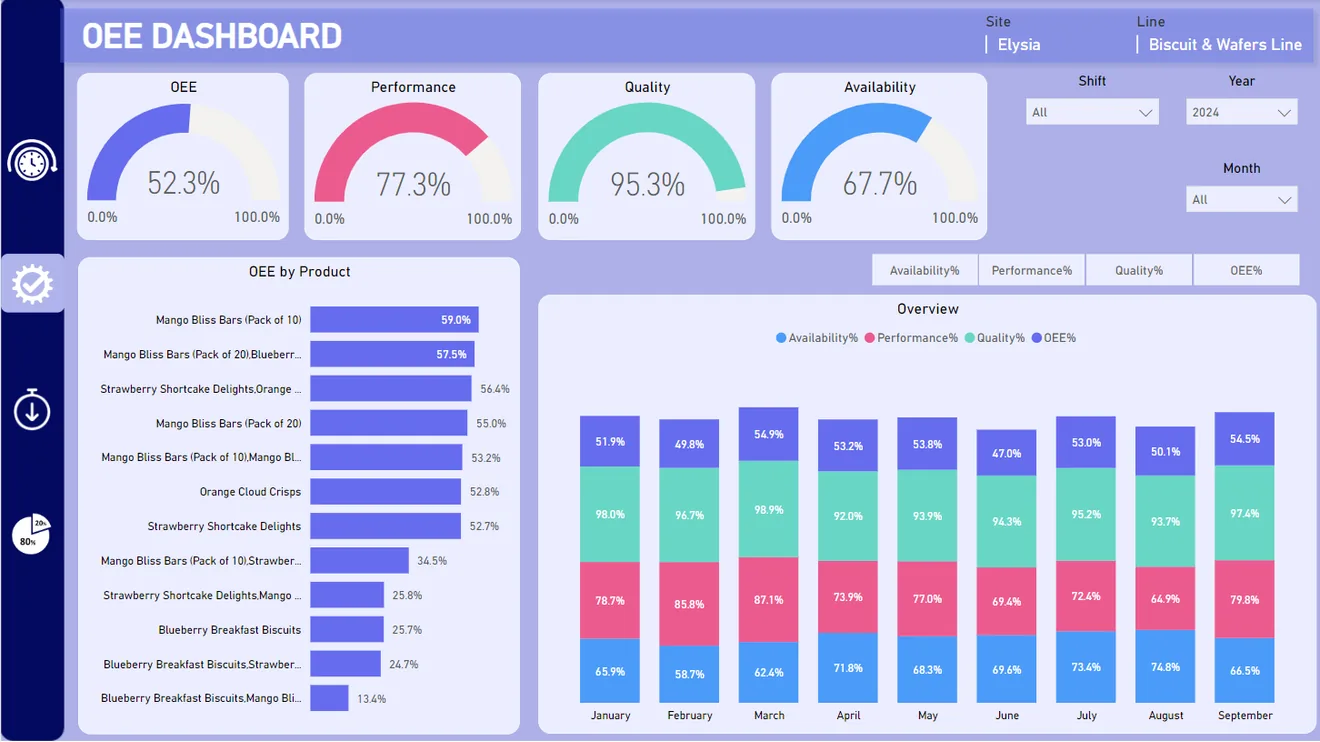
Manufacturing dashboard
Use this when production output, downtime, quality, and line performance decide whether orders can be fulfilled profitably. Keep the first page focused on OEE, availability, performance, quality, and product-level exceptions.
- OEE
- Downtime
- Quality rate
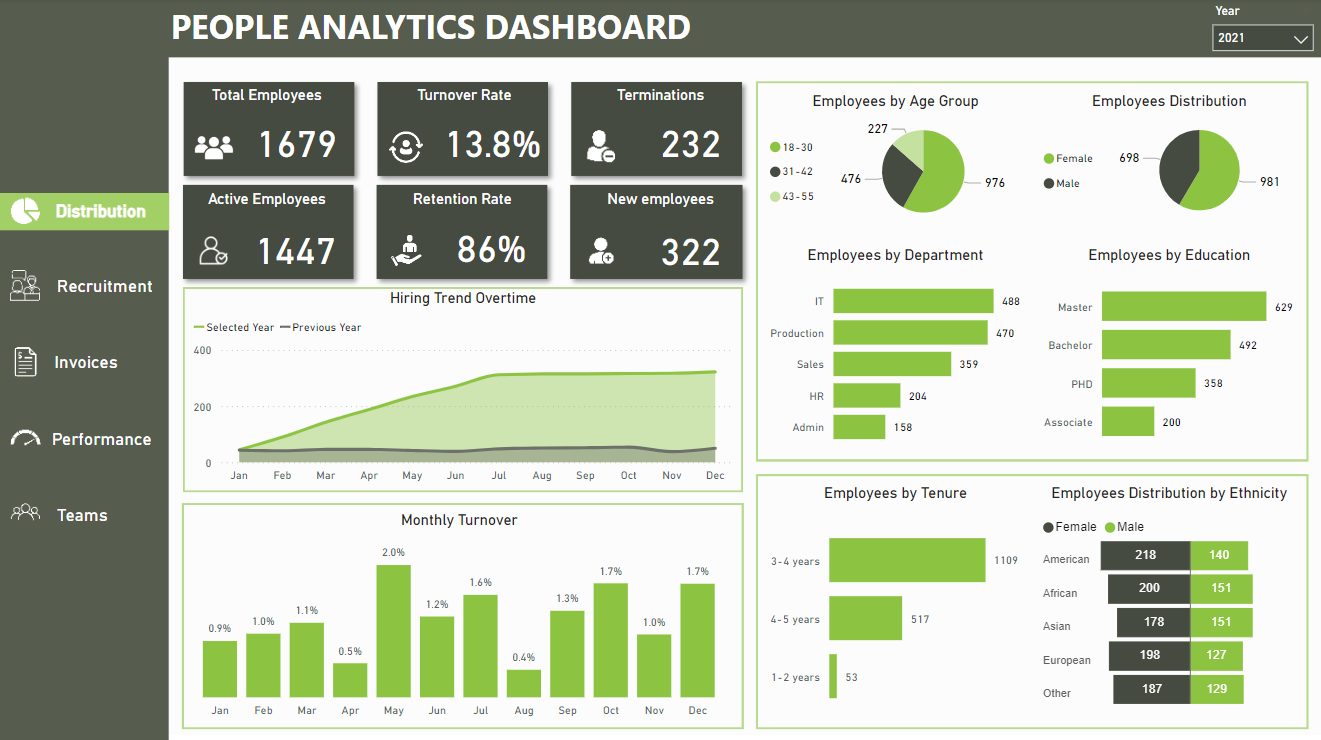
HR and people dashboard
Use this when hiring, attendance, turnover, or team capacity affects service delivery. Track headcount, open roles, hiring pipeline, absence, attrition, overtime, and workload by department.
- Headcount
- Attrition
- Hiring pipeline
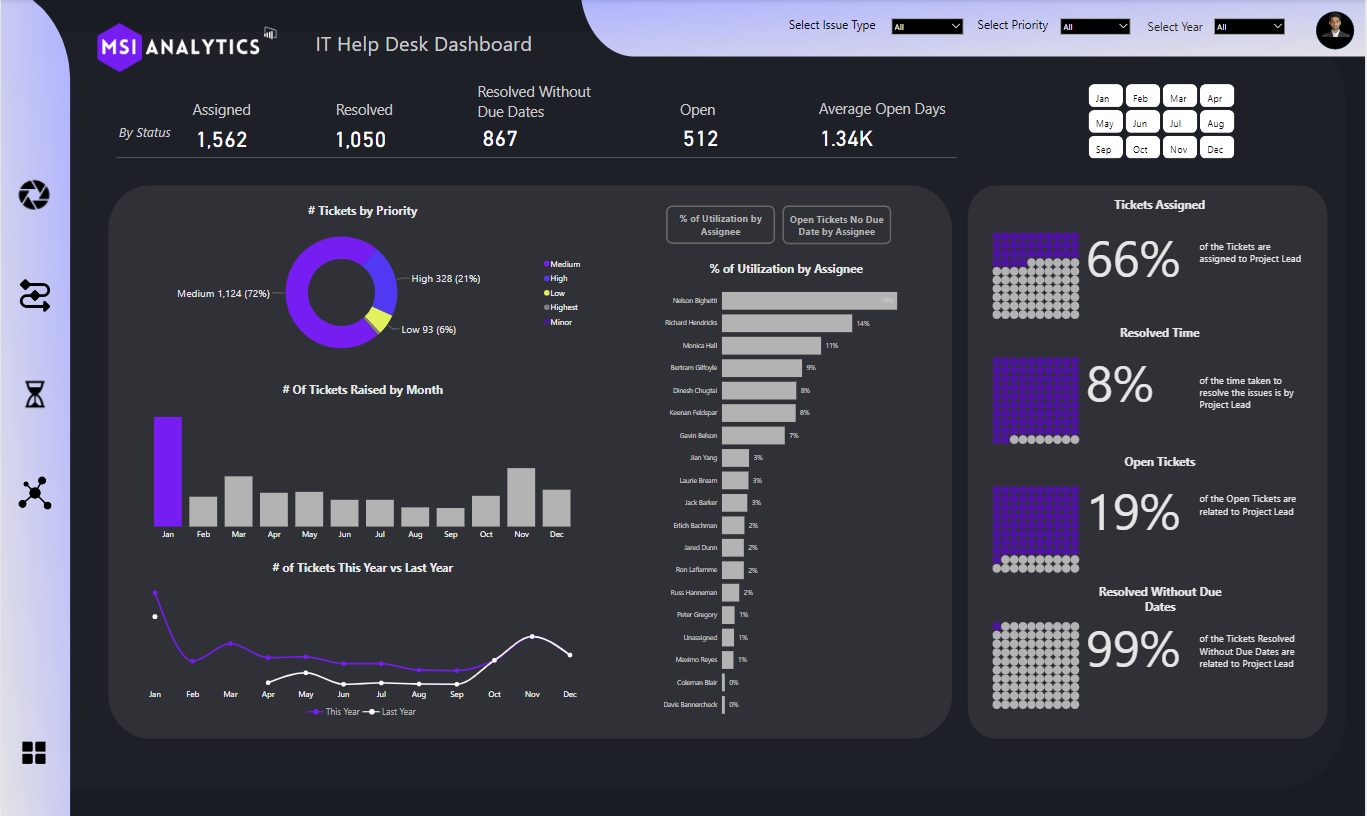
IT help desk dashboard
Use this when internal support delays affect staff productivity or client delivery. Track tickets opened and closed, SLA performance, priority mix, ageing issues, and repeated categories.
- SLA rate
- Ticket ageing
- Priority mix
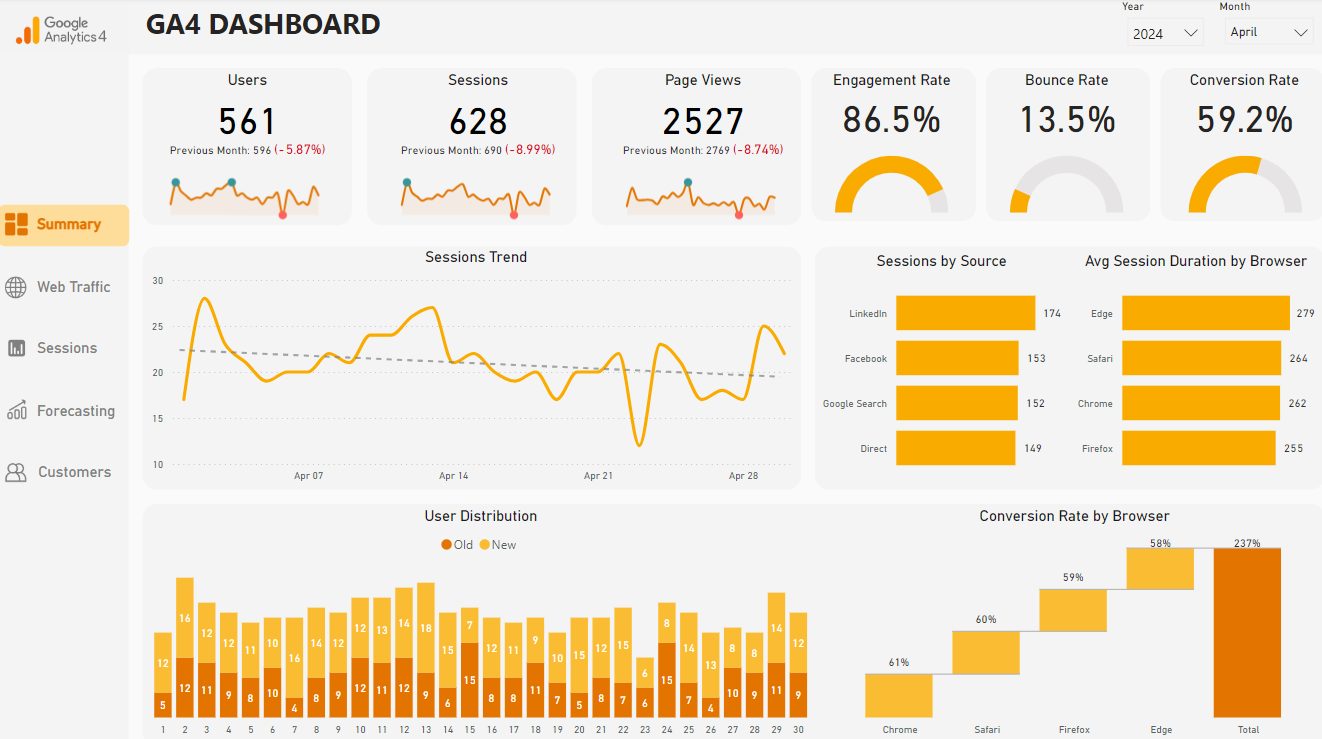
Website analytics dashboard
Use this when the website is a lead or sales channel. A useful page should go beyond visits and show source quality, landing pages, conversions, search traffic, campaign impact, and enquiry behaviour.
- Conversions
- Traffic source
- Landing pages
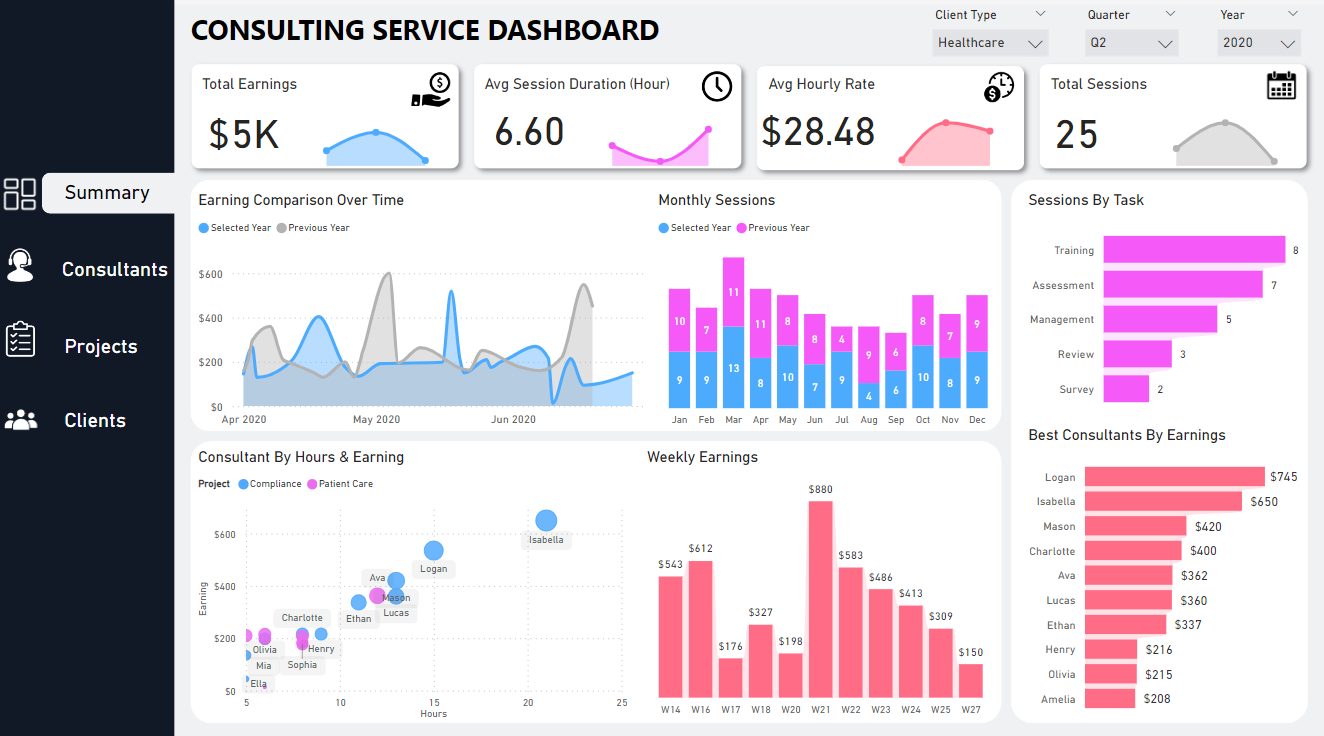
Service business dashboard
Use this for consulting, agency, maintenance, or professional services reporting. Track revenue by service, active projects, utilisation, delivery status, client concentration, and margin by work type.
- Utilisation
- Client revenue
- Project status
Need a small business dashboard built in Power BI?
MSI Analytics can help connect your spreadsheets, CRM, accounting, sales, marketing, or operations data into a Power BI dashboard your team can use without rebuilding reports every week.
What KPIs should a small business dashboard include?
The best KPI list depends on the business model. A local service firm, ecommerce store, agency, clinic, manufacturer, and professional services firm will not need the same first page. Start with the decisions, then choose the KPIs.
| Area | KPIs to consider | Best refresh rhythm | Keep off the first page when |
|---|---|---|---|
| Sales | Revenue, leads, quote value, win rate, pipeline value, average order value | Daily or weekly | The metric cannot be tied to a salesperson, product, service, or source |
| Finance | Cash balance, net profit, gross margin, receivables, payables, budget variance | Weekly or monthly | The accounting data is not reconciled or period definitions are unclear |
| Marketing | Spend, cost per lead, qualified leads, source conversion, landing page conversion | Weekly | The dashboard only shows vanity traffic with no lead or revenue context |
| Operations | Backlog, cycle time, delayed orders, inventory risk, utilisation, quality issues | Daily or weekly | No one owns the process behind the metric |
| Customer | Tickets, response time, resolution time, repeat orders, churn, satisfaction score | Daily or weekly | The business does not have consistent ticket or customer records |
| Inventory | Stock on hand, reorder point, inventory turnover, days inventory outstanding, stockout count | Daily or weekly | Product names, units, and warehouse locations are not standardised |
| Delivery | On-time delivery rate, late orders, failed deliveries, delivery cost, average fulfilment time | Daily or weekly | The order status history is missing or overwritten |
| Procurement | Supplier spend, open purchase orders, supplier lead time, price variance, supplier concentration | Weekly or monthly | Supplier names are duplicated or purchase categories are unclear |
| People | Headcount, absence, overtime, attrition, hiring pipeline, workload by team | Weekly or monthly | HR data is sensitive and access rules are not agreed |
| Web analytics | Sessions, source quality, landing page conversion, form submissions, organic search queries | Weekly | The dashboard cannot connect traffic to leads or sales outcomes |
Use targets carefully. A target is useful only when the team agrees what action should happen if the number misses. Otherwise it becomes decoration.
Ready-made templates or a custom dashboard?
Templates are useful when your reporting question is common and your data source is already clean. A QuickBooks, Shopify, HubSpot, or Google Ads template can save time because the basic fields and measures are already familiar.
The problem starts when the business process does not match the template. A small business may use custom deal stages, split revenue across service lines, track jobs in spreadsheets, or treat deposits, refunds, and recurring work differently from the standard connector. In that case, the template is a starting point, not the finished dashboard.
| Use a template when | Build custom when | What to check before deciding |
|---|---|---|
| You use a common tool with standard fields | Your business relies on custom fields, statuses, or calculations | Can the template match your definitions without manual workarounds? |
| You need a quick visual starting point | You need trusted reporting for recurring management meetings | Will people challenge the numbers after launch? |
| One department owns the report | Several teams need sales, finance, marketing, and operations data together | Do the systems share customer, product, date, or owner keys? |
| The dashboard is mainly for monitoring | The dashboard must explain variance, bottlenecks, or source performance | Does the page need drill paths or only headline KPIs? |
Which dashboard should a small business build first?
Do not build every page at once. Pick the dashboard that removes the most recurring reporting pain. A service firm that loses time chasing unpaid invoices should start with finance and delivery. An ecommerce business spending heavily on ads should start with marketing, sales, and stock. A sales-led business should start with pipeline and follow-up discipline.
| Business situation | Build first | Why it matters |
|---|---|---|
| Owner checks several spreadsheets every week | Owner overview dashboard | It gives one trusted view before building department detail. |
| Cash feels tight even when sales look healthy | Finance and cash flow dashboard | It separates profit from timing, collections, and payment pressure. |
| Leads arrive but sales are inconsistent | Sales and CRM dashboard | It shows whether the issue is lead quality, follow-up, stage conversion, or close rate. |
| Ad spend is growing | Marketing performance dashboard | It connects spend to leads, pipeline, and revenue instead of stopping at clicks. |
| Orders or jobs are delayed | Operations dashboard | It shows backlog, capacity, delays, and quality issues before customers complain. |
Excel, dashboard software, or Power BI?
The right tool depends on how much data you have, where it lives, who needs access, and how often the report must refresh. Excel may be enough for a simple report based on one or two files. Power BI becomes more useful when data is spread across systems or calculations must stay consistent.
| Option | Best when | Limit | MSI view |
|---|---|---|---|
| Excel dashboard | One file, one owner, simple monthly reporting | Manual refresh, version control, fragile formulas | Good starting point for a very small model |
| Dashboard software | You need fast templates for common tools and can accept standard metrics | Custom logic, data ownership, and modelling depth may be limited | Useful for simple plug-and-play reporting |
| Power BI dashboard | You need multiple sources, custom KPIs, refresh, modelling, security, or Microsoft ecosystem fit | Needs proper setup and governance | Best fit when reporting must match how the business actually works |
| Databox | Template-led reporting for common marketing, sales, finance, and ecommerce sources | Best when standard connectors and template metrics are enough | Custom business logic, deeper modelling, or Microsoft-first governance may push you toward Power BI |
| Geckoboard | Live dashboard displays and team performance boards | Best when teams need simple shared dashboards on screens | Less suitable when the main challenge is data modelling across messy sources |
| Looker Studio | Web, marketing, and Google ecosystem reporting | Best when the data is mostly Google Analytics, Search Console, Ads, or Sheets | Power BI is usually stronger for Microsoft, finance, modelling, and governed internal reporting |
| Tableau | Advanced visual analytics and enterprise BI | Best when the organisation already uses Tableau or needs that analytics stack | Can be heavier than a small business needs if Power BI already fits the budget and tools |
Microsoft’s documentation lists many supported Power BI data sources and explains scheduled refresh in the Power BI service. That matters for small businesses because the goal is not to build one attractive report. The goal is to stop manually rebuilding the same report.
How much does a small business dashboard cost?
The cost depends less on the chart count and more on the data work behind the dashboard. A simple Power BI dashboard from one clean spreadsheet is very different from a multi-source model that joins accounting, CRM, advertising, ecommerce, and operations data.
| Cost driver | Why it matters | Question to answer first |
|---|---|---|
| Data sources | Each source needs extraction, cleaning, relationships, and refresh checks | Which systems must the dashboard read from? |
| KPI definitions | Unclear definitions cause disputes after launch | Who approves revenue, margin, lead, and status definitions? |
| Refresh | Manual, scheduled, and gateway-based refresh have different setup needs | How fresh must the dashboard be for the decision? |
| Dashboard pages | More pages add design, testing, navigation, and user training | Which pages answer different decisions? |
| Security | Role-based access and sensitive financial data need extra testing | Who should see all data, and who should see only their area? |
MSI publishes its current consulting and managed-service rates on the MSI costs page. For a project estimate based on your data sources, KPIs, refresh needs, and users, use the contact page.
How MSI Analytics builds small business dashboards
A useful dashboard project should begin before Power BI opens. The first job is to decide what the owner, manager, or team needs to know and what action should follow from each metric.
- Define the decisions. List the weekly or monthly questions the dashboard must answer.
- Map the data. Identify spreadsheets, CRM tables, accounting exports, ecommerce stores, and operational files.
- Clean and model the data. Standardise names, dates, accounts, products, owners, and statuses before writing measures.
- Build the first dashboard page. Start with the owner view, then add detail pages only where they help investigation.
- Test the numbers. Reconcile selected periods against the source systems before anyone relies on the report.
- Publish and refresh. Set access, refresh, and ownership so the dashboard survives beyond the first demo.
You can see more MSI dashboard work on the showcase page, and compare broader Power BI KPI dashboard examples when choosing layouts and KPI groups.
Common mistakes to avoid
Starting with visuals
A dashboard that starts with charts usually becomes crowded. Start with the decision, then choose the visual that explains it fastest.
Tracking too many KPIs
If every number is on the first page, the page stops helping. Move detail into drill paths or secondary pages.
Ignoring data quality
Wrong dates, duplicate customers, inconsistent product names, and missing owners will damage trust faster than a plain design.
No metric ownership
Each important KPI needs an owner. If no one owns the number, no one fixes it when it moves.
Frequently asked questions
What is the best dashboard for a small business?
The best dashboard is usually an owner dashboard that combines sales, cash, pipeline, work in progress, and exceptions. After that, add function-specific pages for finance, sales, marketing, operations, or customer service.
What should be on a small business dashboard?
Include the KPIs that explain performance and trigger action: revenue, cash, profit, leads, conversion, receivables, backlog, delayed work, customer activity, and the most important operational risks.
Is Power BI good for small businesses?
Power BI is a good fit when the business has multiple data sources, custom calculations, repeated reporting, or a Microsoft-heavy workflow. For one simple spreadsheet, Excel may be enough.
Can I build a dashboard from Excel?
Yes. Excel can be a source for Power BI or the dashboard tool itself. The risk is that manual copying, inconsistent formulas, and multiple file versions can make reporting hard to trust as the business grows.
How often should a small business dashboard refresh?
Match refresh to the decision. Sales and operations may need daily refresh. Finance may work weekly or monthly. Faster refresh is not useful if the source data is not updated or reconciled.
How much does a Power BI dashboard cost for a small business?
Cost depends on data sources, cleaning, KPI definitions, dashboard pages, refresh, and security. A clean single-source dashboard is simpler than a governed model that combines CRM, finance, marketing, and operations data.
Build the dashboard your business actually needs
If your reporting is spread across spreadsheets, CRM exports, accounting files, and ad platforms, MSI Analytics can help turn it into a Power BI dashboard with clear KPIs and reliable refresh.