
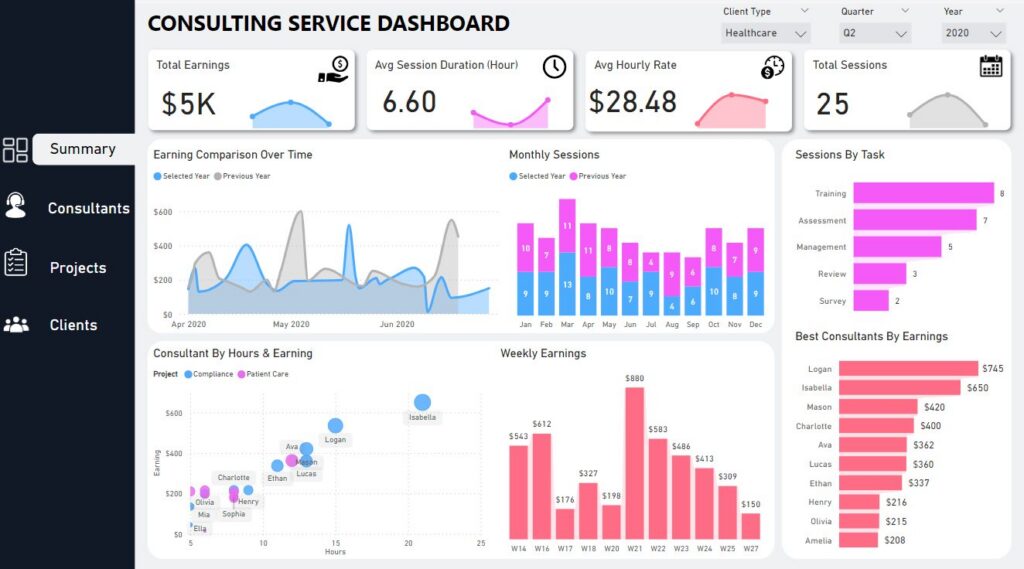
MANAGEMENT REPORTING GUIDE
See practical manager reports for finance, sales, HR, operations, marketing, service, and executive teams, with the KPIs and decisions each report should support.
Good manager reports do more than show numbers. They tell a manager what changed, whether it matters, and what action needs attention next. A useful management report usually combines KPI performance, target variance, trend movement, short commentary, risks, and named actions. These management reports examples show how that structure works across different business areas.
If your monthly pack is mostly copied charts, stale Excel tabs, and numbers nobody trusts, the problem is rarely reporting frequency. The problem is report design. A report sent every week can still be useless if it does not answer a real management question.
Use management reporting examples as a starting point, then adapt the KPIs, filters, targets, and commentary to the decisions your managers actually make. A sales manager needs pipeline risk and activity quality. A finance manager needs margin, cash, and variance. An operations manager needs service levels, capacity, delays, and exceptions.
What manager reports are
Manager reports are recurring reports that help leaders run part of a business. They usually cover performance against targets, trends over time, risks, exceptions, and next actions. They are different from statutory or compliance reports because their job is internal decision support, not external filing.
A management report should be built around an owner and a decision. Before choosing visuals or KPIs, ask who will use the report and what they need to decide after reading it. That question keeps the report practical.
Finance, CRM, HR, operations, marketing, ecommerce, and service systems.
Consistent definitions, date logic, targets, variance rules, and ownership.
Pages that show performance, exceptions, trend movement, and detail.
Meeting cadence, commentary, decisions, owners, and follow-up actions.
What every manager report should include
A good manager report does not need dozens of metrics. It needs the right few metrics with enough context to act. For most teams, five to seven primary KPIs are easier to use than a crowded page of disconnected charts.
Performance
Show the current result, target, variance, and trend. The reader should see whether performance is good, bad, or drifting.
Explanation
Add short commentary that explains what changed and why. Numbers without context create longer meetings.
Action
Show the next step, owner, and due date where action is needed. Reporting should reduce ambiguity, not create it.
Most manager reports should include these parts:
- Report objective and audience
- Current period performance
- Target, budget, or benchmark comparison
- Trend over time
- Variance and exception highlights
- Short commentary explaining the movement
- Risks, blockers, and next actions
- Drill-through detail for managers who need to investigate
Management reporting examples by team
The best management reporting examples are specific to the team. A finance report, sales report, and HR report may all sit in the same monthly pack, but each one should answer a different management question.
| Report example | Main question it answers | Useful KPIs | Manager action |
|---|---|---|---|
| Executive overview | Are we on track overall? | Revenue, gross margin, cash, pipeline, customer retention, service level, headcount | Prioritise the biggest risks and decide where leadership attention is needed. |
| Finance management report | Where are profit, cash, and cost moving away from plan? | Revenue, cost, EBITDA, gross margin, cash balance, aged receivables, budget variance | Control spend, review pricing, chase receivables, or reforecast. |
| Sales manager report | Is the team creating enough quality pipeline to hit target? | Pipeline value, weighted pipeline, win rate, conversion, deal velocity, activity, forecast coverage | Coach reps, unblock deals, rebalance territories, or adjust forecast confidence. |
| Marketing report | Which channels are creating qualified demand? | Leads, conversion rate, cost per lead, cost per acquisition, source mix, campaign ROI | Shift budget, pause weak campaigns, improve landing pages, or review lead quality. |
| HR manager report | Where are workforce risks building? | Headcount, attrition, hiring funnel, absence, payroll cost, vacancy count, engagement | Plan hiring, address retention risk, manage absence, or review workforce cost. |
| Operations report | Are service levels, quality, and capacity under control? | Throughput, backlog, on-time delivery, cycle time, defect rate, utilisation, downtime | Fix bottlenecks, adjust staffing, chase delays, or address quality issues. |
| Inventory report | Are stock levels supporting sales without tying up cash? | Stock value, stockouts, excess stock, days on hand, reorder risk, slow-moving items | Reorder, discount, transfer, or reduce purchasing risk. |
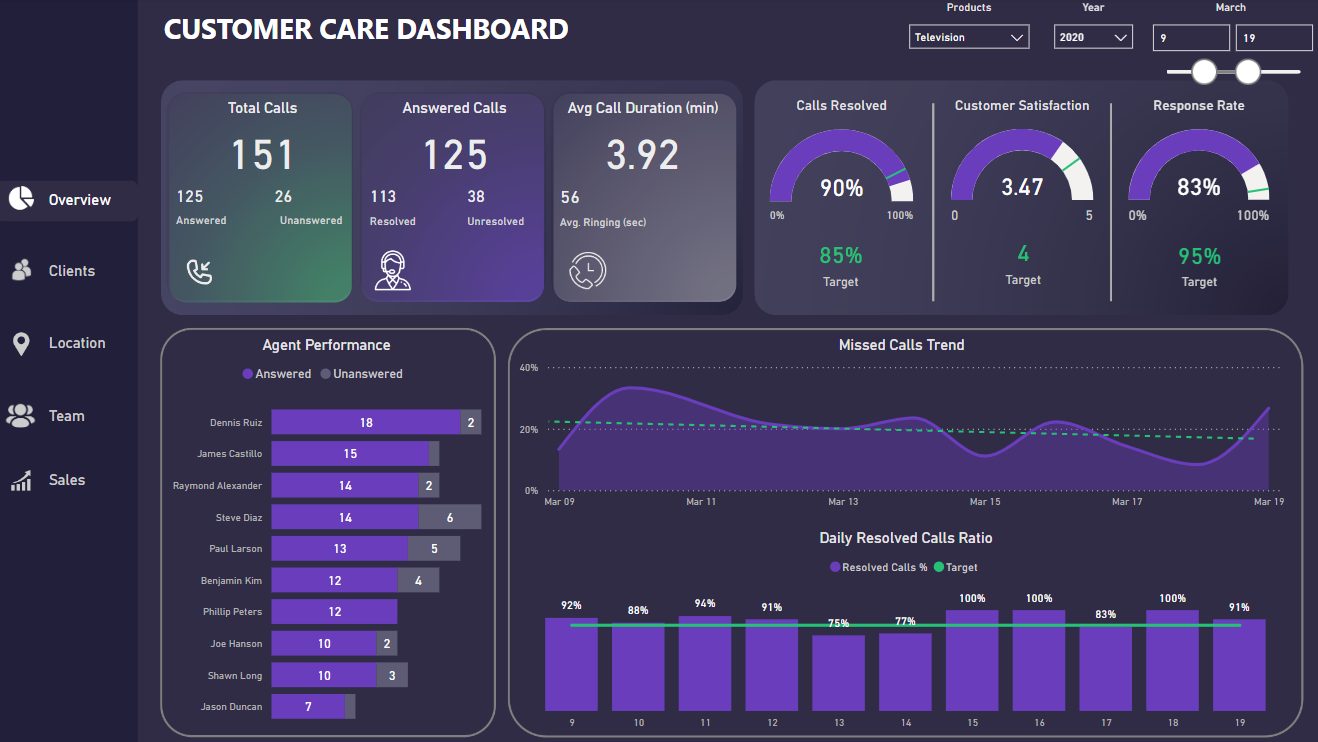
| Customer support report | Are customers getting timely and consistent service? | Tickets, first response time, resolution time, SLA compliance, backlog, satisfaction | Reassign workload, improve processes, or escalate recurring issues. |
For a broader library of report layouts, MSI also keeps Power BI KPI dashboard examples across sales, finance, marketing, operations, HR, service, and ecommerce reporting.
Finance management report example
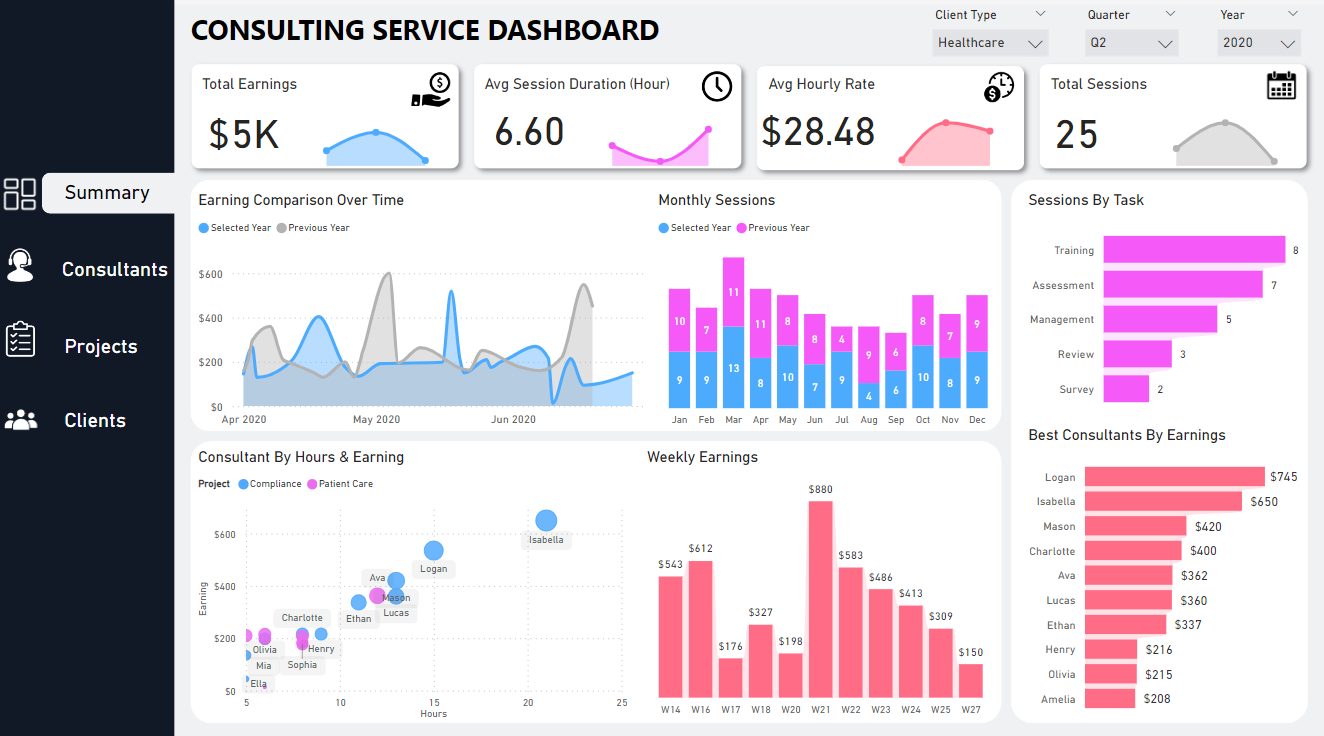
A finance management report should help managers understand whether the business is making money, protecting cash, and staying close to plan. It should not only repeat an income statement. Managers need variance, context, and detail they can act on.
Useful sections include profit and loss summary, revenue by product or customer segment, cost variance, margin movement, cash position, receivables ageing, and forecast risk. A strong finance report also shows which accounts or customers explain the movement, so the finance team does not need to rebuild the answer manually after every meeting.
For a deeper finance-specific layout, see the MSI guide to financial dashboards in Power BI.
Sales manager report example
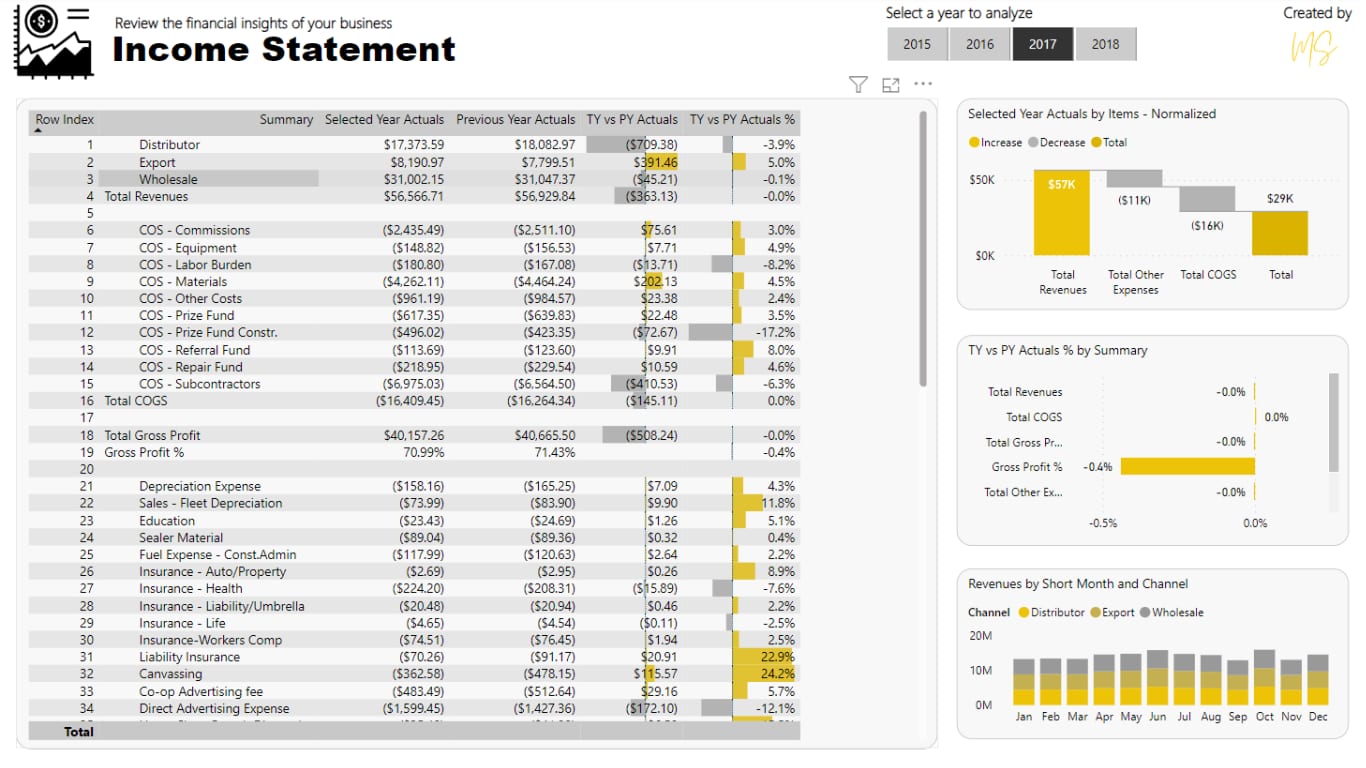
A sales manager report should show whether the team has enough quality pipeline to hit target. Revenue alone is late feedback. Managers also need leading indicators such as new opportunities, conversion rate, deal velocity, pipeline ageing, next activity, and forecast coverage.
The most useful sales reports separate activity from progress. A team can log plenty of calls and still have weak pipeline quality. The report should help a manager see which deals need coaching, which stages are stuck, and where the forecast is too optimistic.
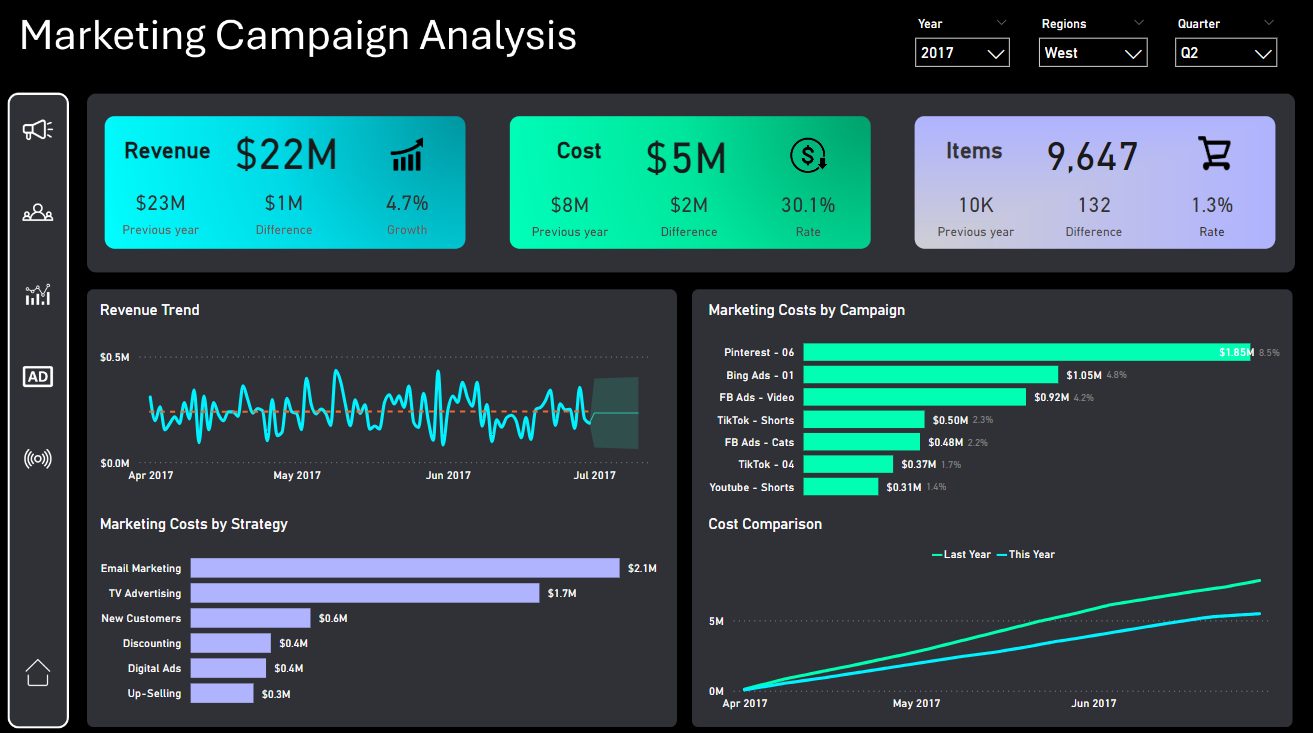
Marketing manager report example
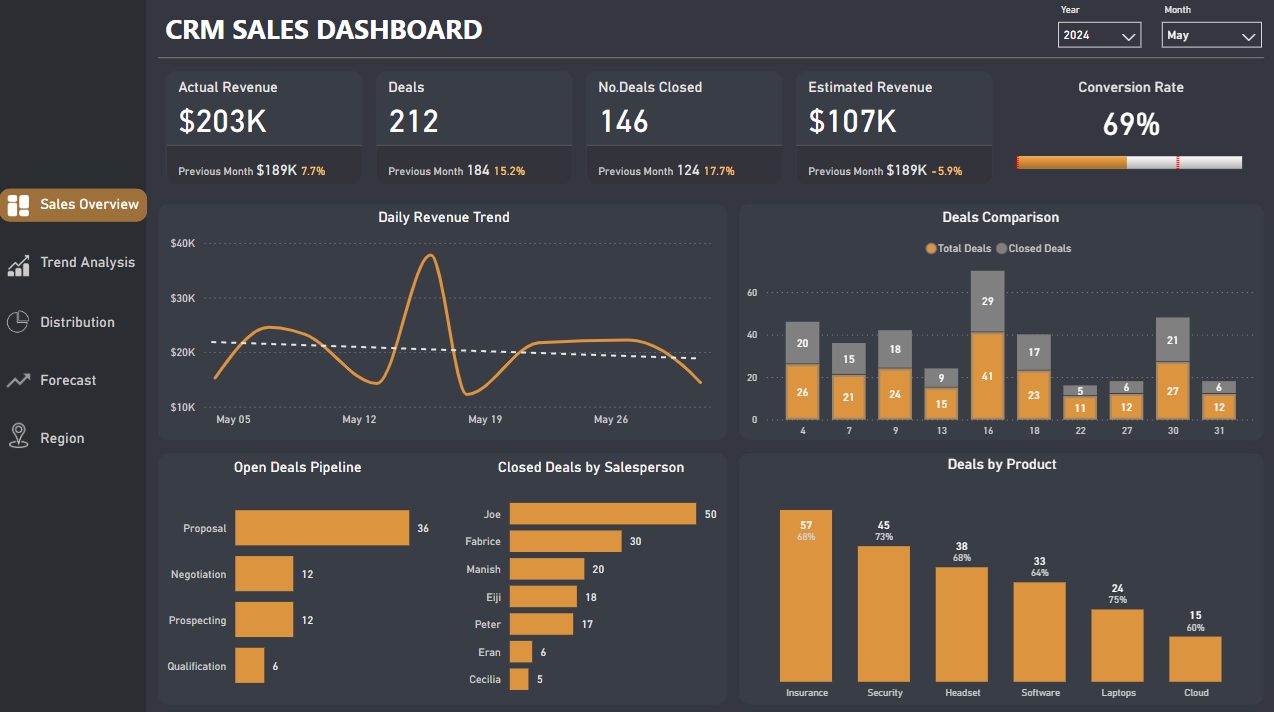
A marketing manager report should connect campaign spend to qualified demand. The report needs more than impressions and clicks. Managers need to see which channels produce leads, which leads convert, and where acquisition cost is drifting away from target.
Useful marketing report sections include spend by channel, leads by source, conversion by stage, cost per lead, cost per acquisition, landing page performance, campaign return, and follow-up quality. The best version also separates volume from quality, because a campaign can create many leads that sales cannot use.
HR manager report example
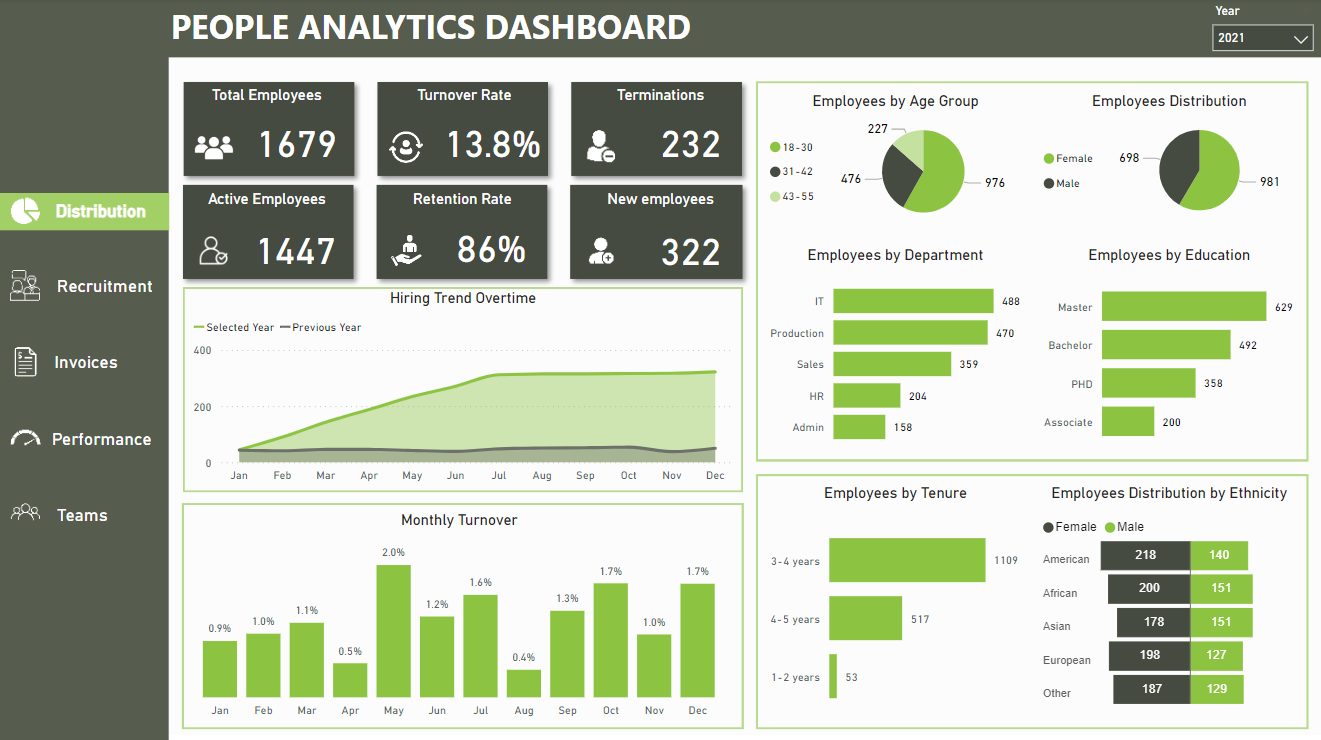
An HR manager report should connect headcount, hiring, attrition, absence, payroll cost, and workforce risk. A useful HR report helps managers decide where to hire, where turnover is rising, and whether the current workforce plan supports business demand.
For workforce reporting, the report also needs security. Employee-level detail should be restricted to people who are allowed to see it. MSI covers the reporting model and KPI structure in its guide to Power BI HR dashboards.
Operations manager report example
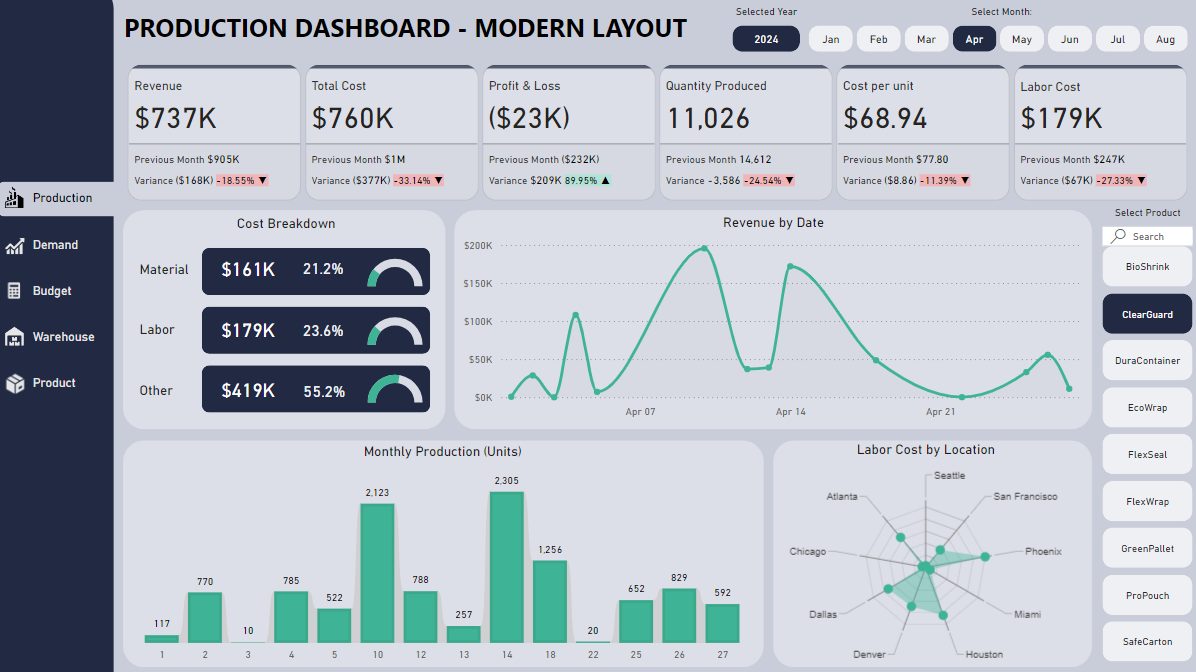
An operations manager report should show whether work is flowing at the right speed, cost, and quality. The page should focus on bottlenecks, overdue work, service level risk, capacity, backlog, downtime, and the reasons output is below plan.
This example matters because operations reporting often fails when it only shows output totals. Managers also need the drivers behind the total, such as queue length, cycle time, defects, utilisation, machine downtime, delivery delay, or rework.
Inventory management report example
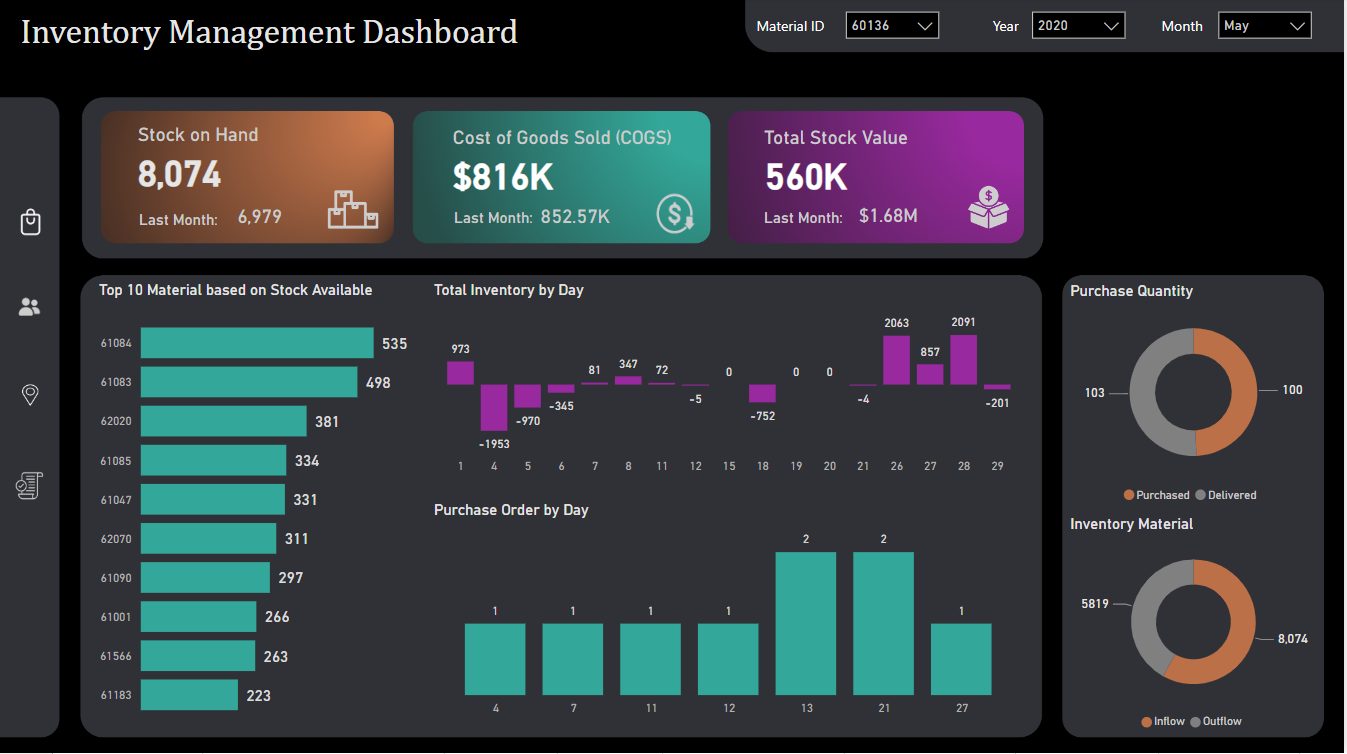
An inventory management report should help managers balance availability and cash. Too little stock creates missed sales and service issues. Too much stock ties up cash, hides slow-moving items, and increases write-off risk.
Useful KPIs include stock value, stockout risk, excess stock, days on hand, reorder point exceptions, supplier delays, inventory turns, and slow-moving products. The report should make the next decision clear: reorder, transfer, discount, investigate demand, or stop buying.
Customer support manager report example
A customer support manager report should show whether customers are getting timely, consistent help. Ticket volume is only one part of the picture. Managers also need first response time, resolution time, backlog age, SLA compliance, repeat contacts, escalation reasons, and customer satisfaction.
The report should help the support manager decide where to move capacity, which issue categories need process fixes, and which customers or products need escalation. A good support report turns recurring tickets into improvement work, not just queue monitoring.
Monthly management report structure
A monthly management report should be short enough to read and structured enough to run a meeting. The strongest format is usually a summary first, then exception pages, then detail for investigation.
- Executive summary. Show the most important movements and risks in one page.
- KPI scorecard. Compare actuals with target, prior period, and trend.
- Variance commentary. Explain the biggest positive and negative movements.
- Department pages. Separate finance, sales, HR, operations, marketing, and service performance.
- Risks and actions. Name the owner, action, and due date for follow-up.
- Detail pages. Provide drill-through tables for managers who need to inspect records.
Managers should not need to ask, “Where did this number come from?” The report should make the path from headline KPI to supporting detail clear enough to trust.
Dashboard, spreadsheet, or static report
Different reporting formats have different jobs. A spreadsheet is useful for modelling and ad hoc analysis. A static PDF can work when a board or committee needs a fixed pack. A Power BI dashboard is better when managers need filters, drill-through, scheduled refresh, and shared definitions.
| Format | Best use | Limit |
|---|---|---|
| Spreadsheet report | Fast analysis, modelling, and one-off requests | Version control, manual refresh, and inconsistent formulas |
| Static PDF pack | Formal monthly or board reporting | Limited drill-down and slow investigation |
| Power BI dashboard | Recurring manager reports with filters, drill-through, and shared KPIs | Needs a controlled data model, refresh rules, and security design |
If you are planning a wider reporting build, the Power BI KPI dashboard guide explains how to define KPIs, targets, model structure, and page layouts before development starts.
How to build a management reporting system in Power BI
A management reporting system is the process behind the report. In Power BI, that usually means source connections, Power Query transformations, a semantic model, measures, report pages, permissions, refresh, and ownership.
Microsoft recommends star schema principles for Power BI semantic models, where dimension tables support filtering and grouping, and fact tables support summarisation. That matters for manager reports because a clean model makes KPIs easier to reuse across departments.
List the recurring management questions before choosing visuals.
Create shared measures for actual, target, variance, trend, and status.
Build summary, exception, department, and drill-through pages.
Set ownership, scheduled refresh, access rules, and validation checks.
For most management reporting, scheduled refresh is enough. Avoid calling a report real time unless the data source and Power BI architecture truly support it. Microsoft documents refresh options separately from security controls such as row-level security, which can restrict what different managers see.
Common mistakes to avoid
- Too many KPIs. A crowded report hides the signal managers need.
- No targets. A number without a target does not tell the reader if action is needed.
- No trend. Managers need to know whether performance is improving or getting worse.
- Inconsistent definitions. If every team calculates revenue, headcount, or conversion differently, meetings turn into data debates.
- No commentary. Charts show movement, but commentary explains why it happened.
- No security design. Manager reports can contain sensitive finance, HR, payroll, or customer data.
- Manual refresh without ownership. If nobody owns the refresh process, trust fades quickly.
When to rebuild your manager reports
Rebuild your management reports when managers spend more time explaining the numbers than acting on them. Other warning signs include repeated manual exports, conflicting KPI definitions, reports that arrive after decisions are made, and dashboards that cannot drill into the detail behind a variance.
For small and growing teams, the MSI guide to dashboard examples for small business can help decide which report areas to build first.
Discuss your management reporting setup
MSI Analytics can review your current spreadsheets, finance reports, CRM dashboards, and operations packs, then suggest a practical route to cleaner manager reports in Power BI.
Contact MSI Analytics to discuss your reporting dashboard needs.
Frequently asked questions
What is a manager report?
A manager report is an internal report that helps a manager monitor performance, spot exceptions, and decide what action to take. It usually includes KPIs, targets, trends, commentary, risks, and next steps.
What is the difference between management reporting and financial reporting?
Management reporting supports internal business decisions. Financial reporting often follows formal accounting or external reporting requirements. A management report may include finance data, but it is usually broader and more action-focused.
How often should manager reports be updated?
The cadence should match the decision. Sales pipeline and operations reports may need daily or weekly refresh. Finance and executive reports often work monthly, with weekly leading indicators where needed.
Can Power BI be used for management reporting?
Yes. Power BI is well suited to management reporting when the data model, KPI definitions, refresh process, and security rules are designed properly.